
Where are people most exposed to particulate matter?
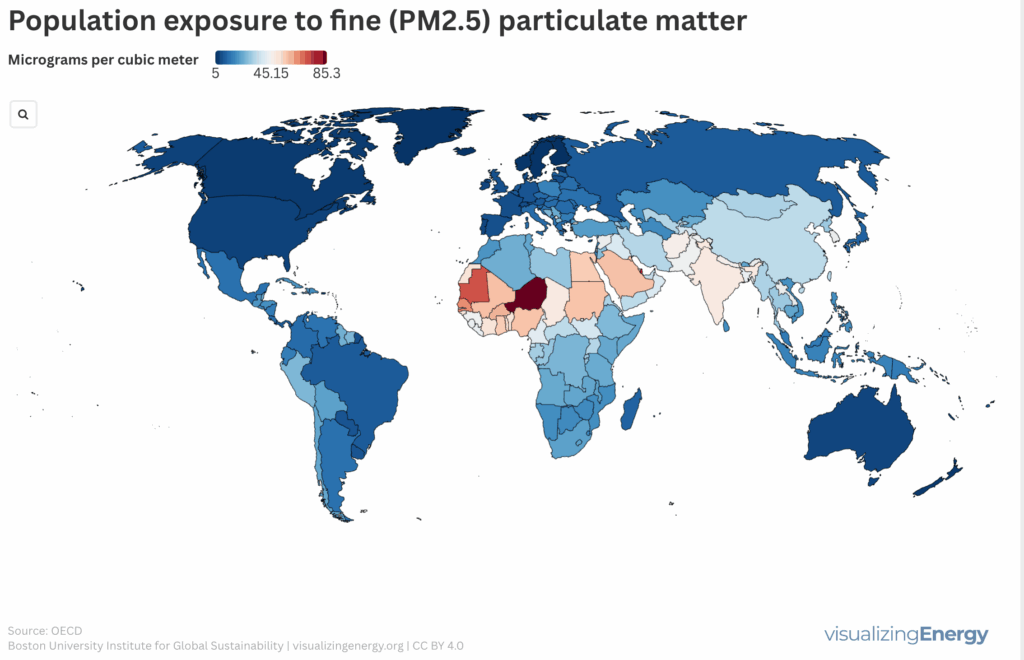
Airborne particulate matter (PM2.5) comprises tiny particles that pose significant health risks, including heart disease and lung cancer. Major sources include natural events and human activities, with notable geographic variations. Reductions in PM2.5 levels have been observed in affluent regions, but exposure remains high in countries like China and India, impacting public health.
Global anthropogenic nitrous oxide emissions, 1970-2022
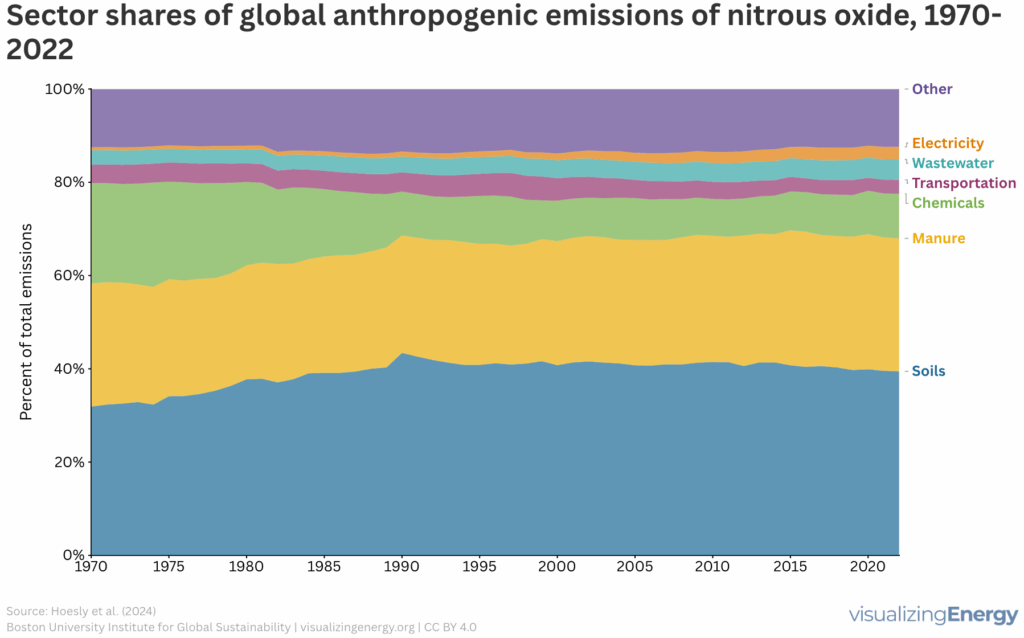
Nitrous oxide (N2O) is a potent greenhouse gas that contributes to climate change and ozone depletion, with human activities significantly increasing its emissions since the 1970s. Key sources include agricultural practices, livestock manure, and industrial emissions. Action is necessary across sectors to mitigate N2O emissions and improve nutrient management strategies.
Explore hydrogen district heating with Sankey diagrams
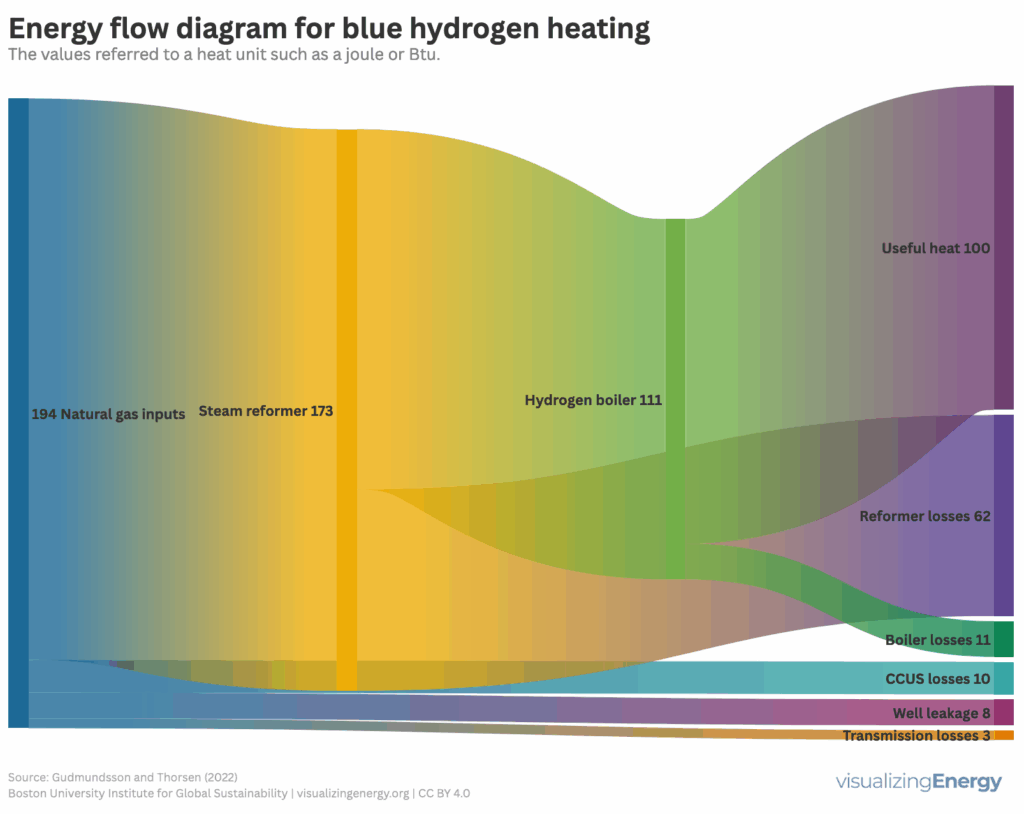
The article examines hydrogen energy as a decarbonization strategy, focusing on its use in district heating systems. It highlights efficiency comparisons between blue and green hydrogen pathways, emphasizing that district heating is generally more efficient and cost-effective. Despite its advantages, high initial costs and regulatory challenges hinder widespread adoption.
Global black carbon emissions, 1750-2022
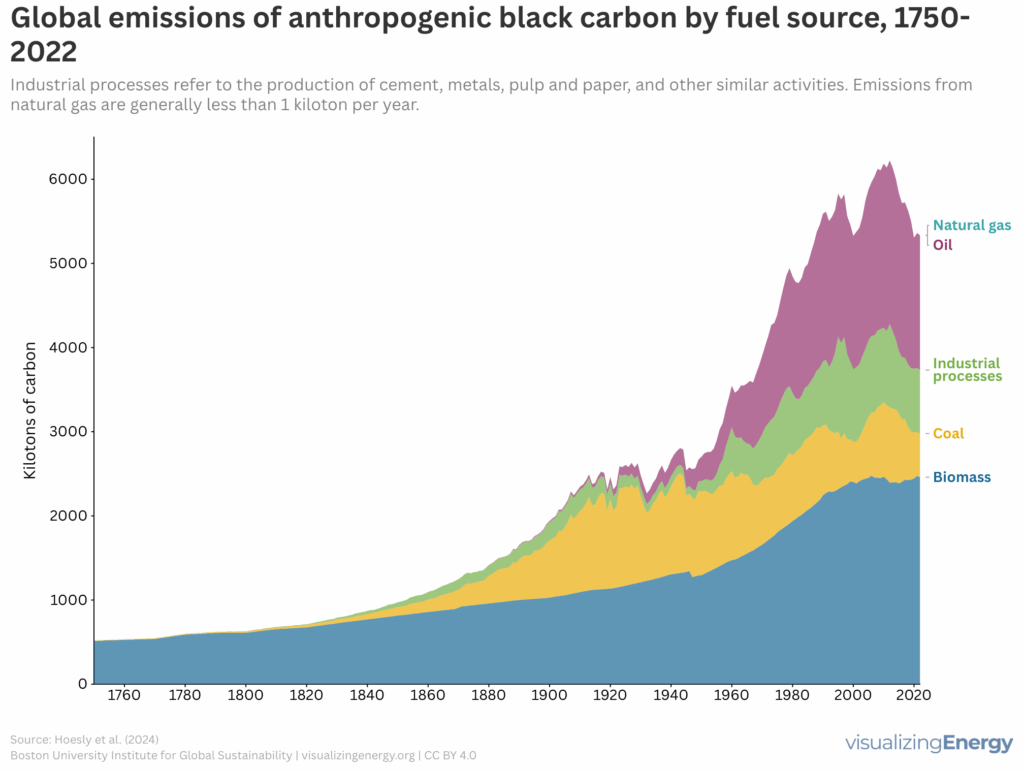
Anthropogenic black carbon, or soot, arises from incomplete combustion of organic materials, significantly impacting climate change and public health. It causes global warming, degrades air quality, and leads to various health issues. Major contributors include residential fuel usage and transportation emissions. Reducing black carbon relies on cleaner fuel access and improved combustion technologies.
The decommissioning of wind turbines in the United States
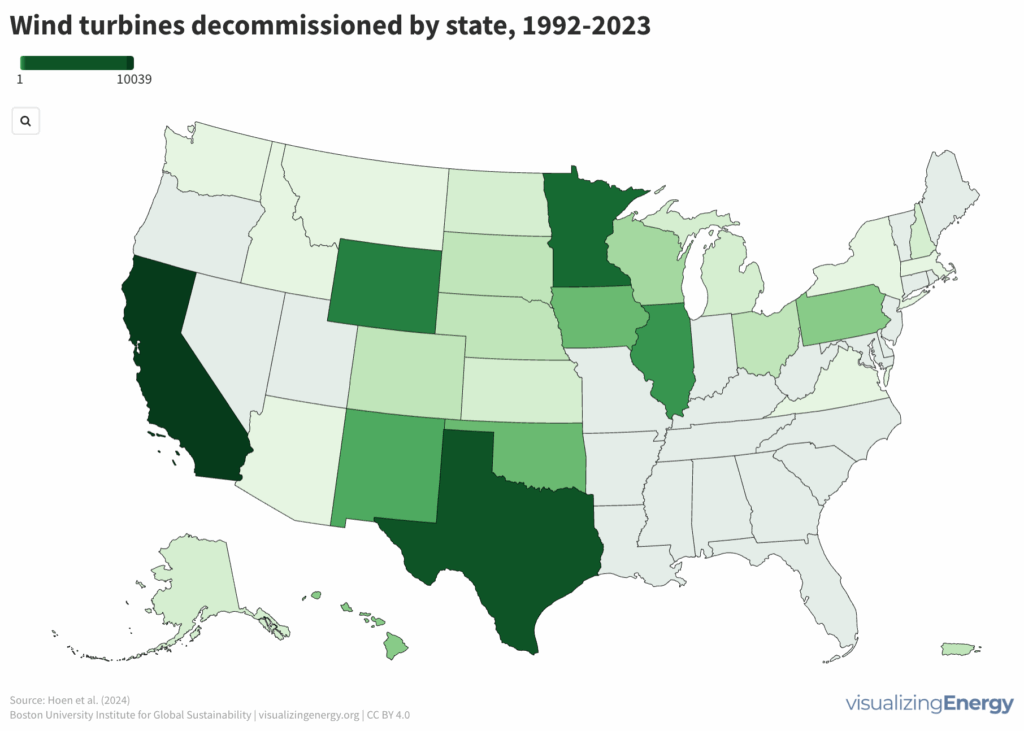
More than 86,000 wind turbines were built in the US from 1981 to early 2024, with over 11,000 decommissioned since 1992. Decommissioning presents waste management challenges, especially with the difficult-to-recycle turbine blades. Research is ongoing for recyclable blades, such as those made from plant material, to address the issue.
Global nuclear power capacity additions
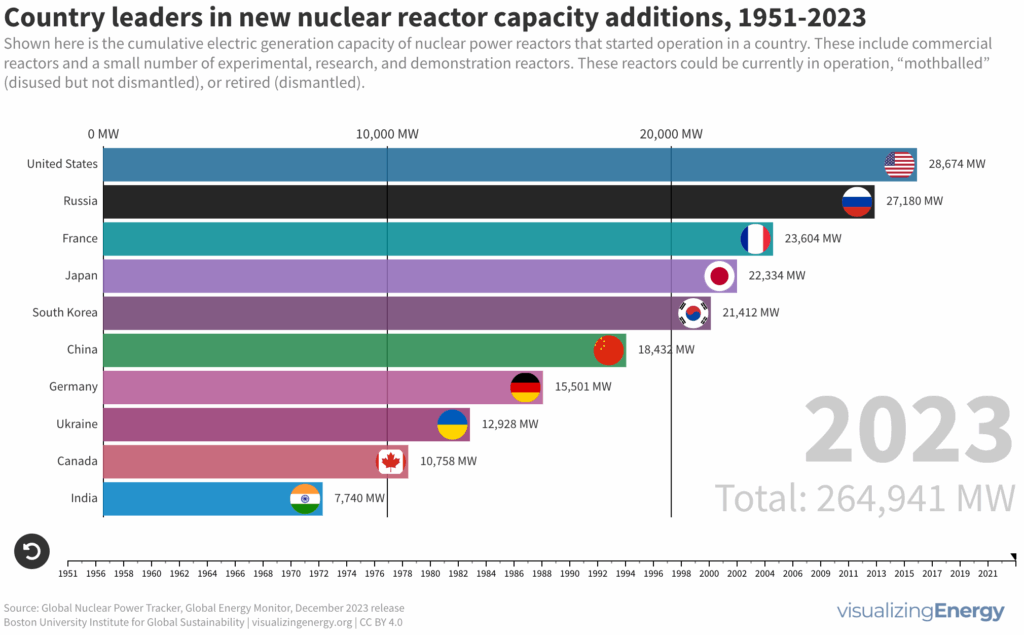
Nuclear power plants have a nameplate capacity of about 390 gigawatts and supply 10% of the world’s electricity. The United States, Russia, France, Japan, South Korea, and China account for 36% of global capacity. Capacity additions have declined due to accidents, rising costs, public opposition, and the increasing attractiveness of renewable power generation.
Electricity generation from nuclear power
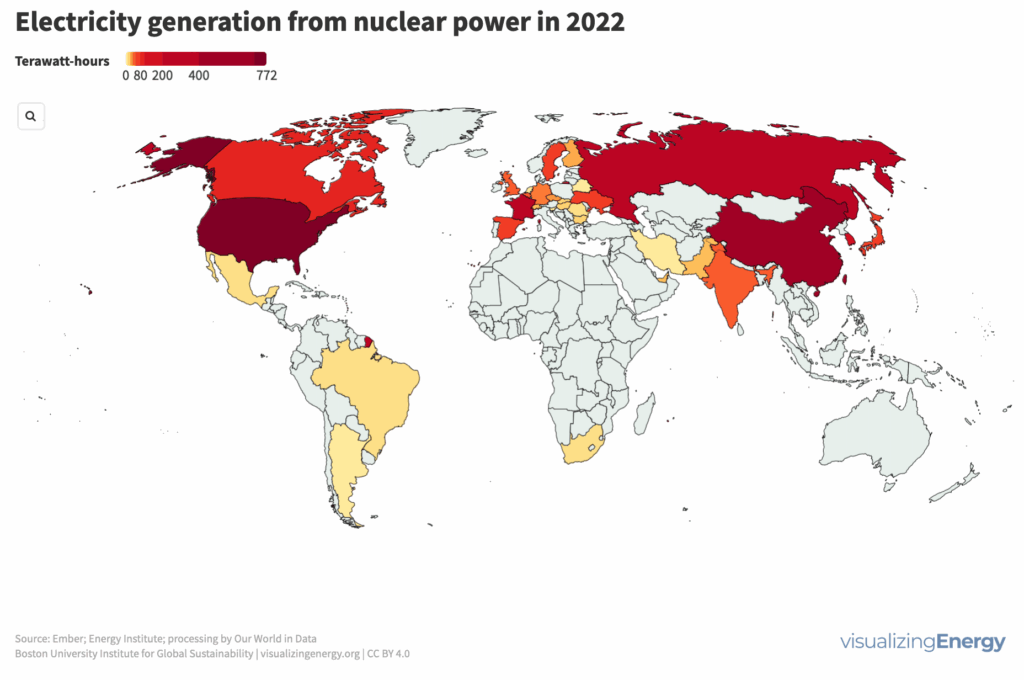
In 2024, 440 nuclear power reactors operated in 32 countries, generating 10% of the world’s electricity. The US, China, France, Russia, and South Korea are the top generators. France leads in nuclear power usage (63%), followed by Slovakia, Hungary, Belgium, and Slovenia. Ukraine’s nuclear operations were impacted by the 2022 Russian invasion, causing fluctuating reactor activity.
Global nuclear reactor startups and retirements, 1951-2024
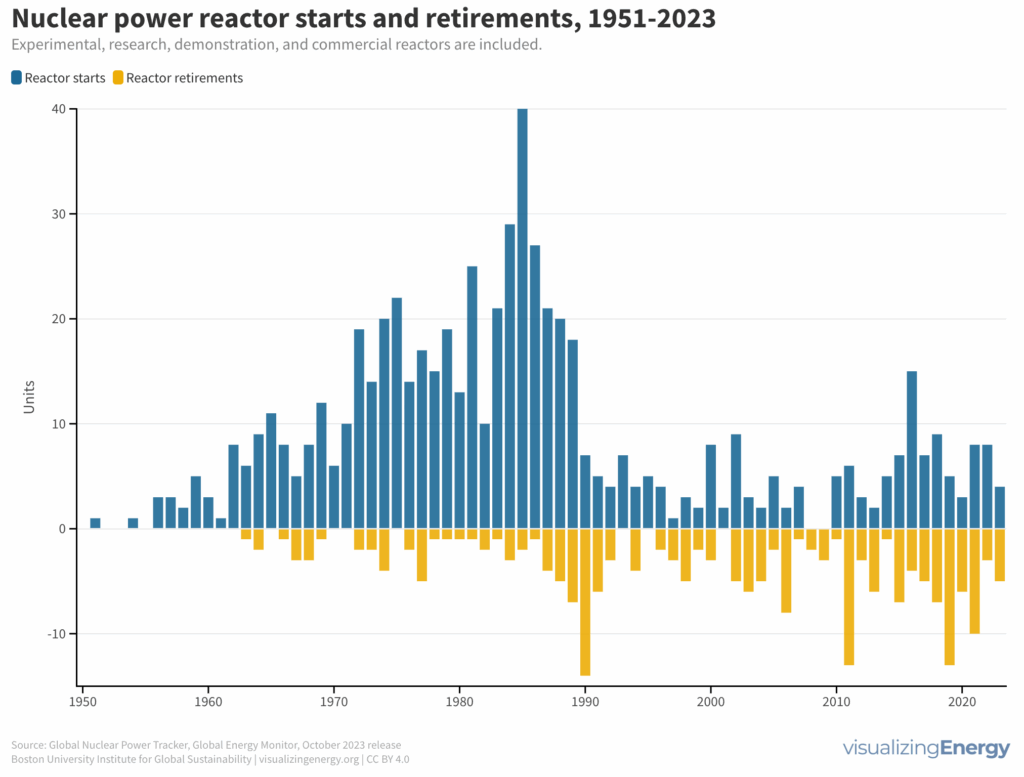
The global nuclear power industry has experienced significant shifts since its post-WWII expansion, with a sharp decline in new reactor starts from the 1990s onwards. More recently, some countries have sought to replace fossil fuels with nuclear power to address emissions and energy security. However, challenges remain in demonstrating the promised benefits of new reactor designs.
Global nuclear reactor construction starts and duration, 1949-2023
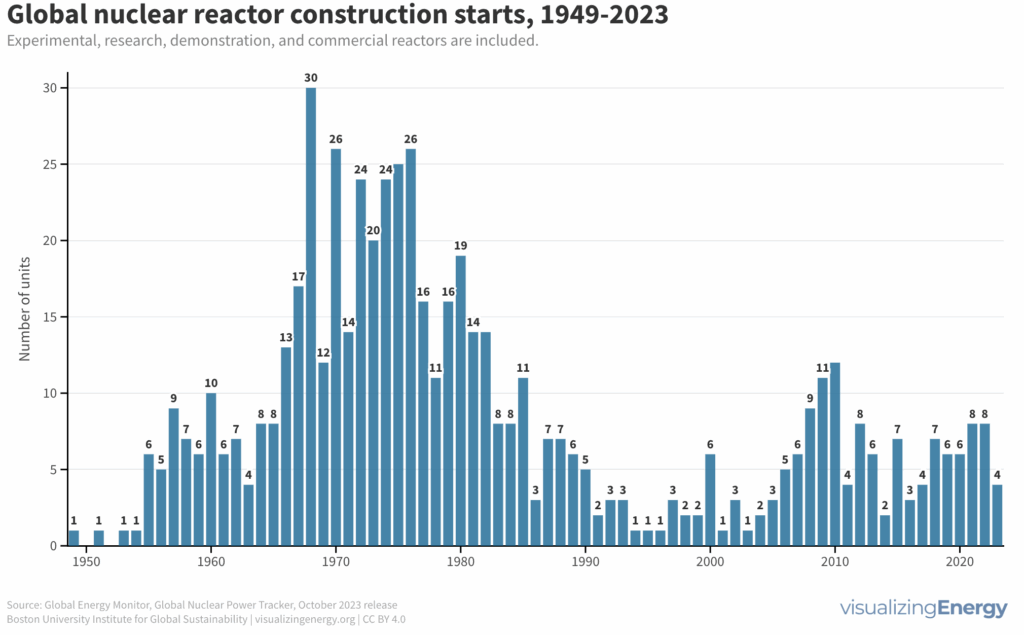
The construction of new nuclear power plants reflects changing electricity demand and technology competitiveness. Despite industry and government support, nuclear power faces challenges such as cost-competitiveness and safety concerns, leading to extended construction times. While some advocate for its expansion as vital for clean energy transition, others question its necessity due to declining global electricity share and the rise of cheaper renewables.
Watch the history of natural gas power plants in the United States
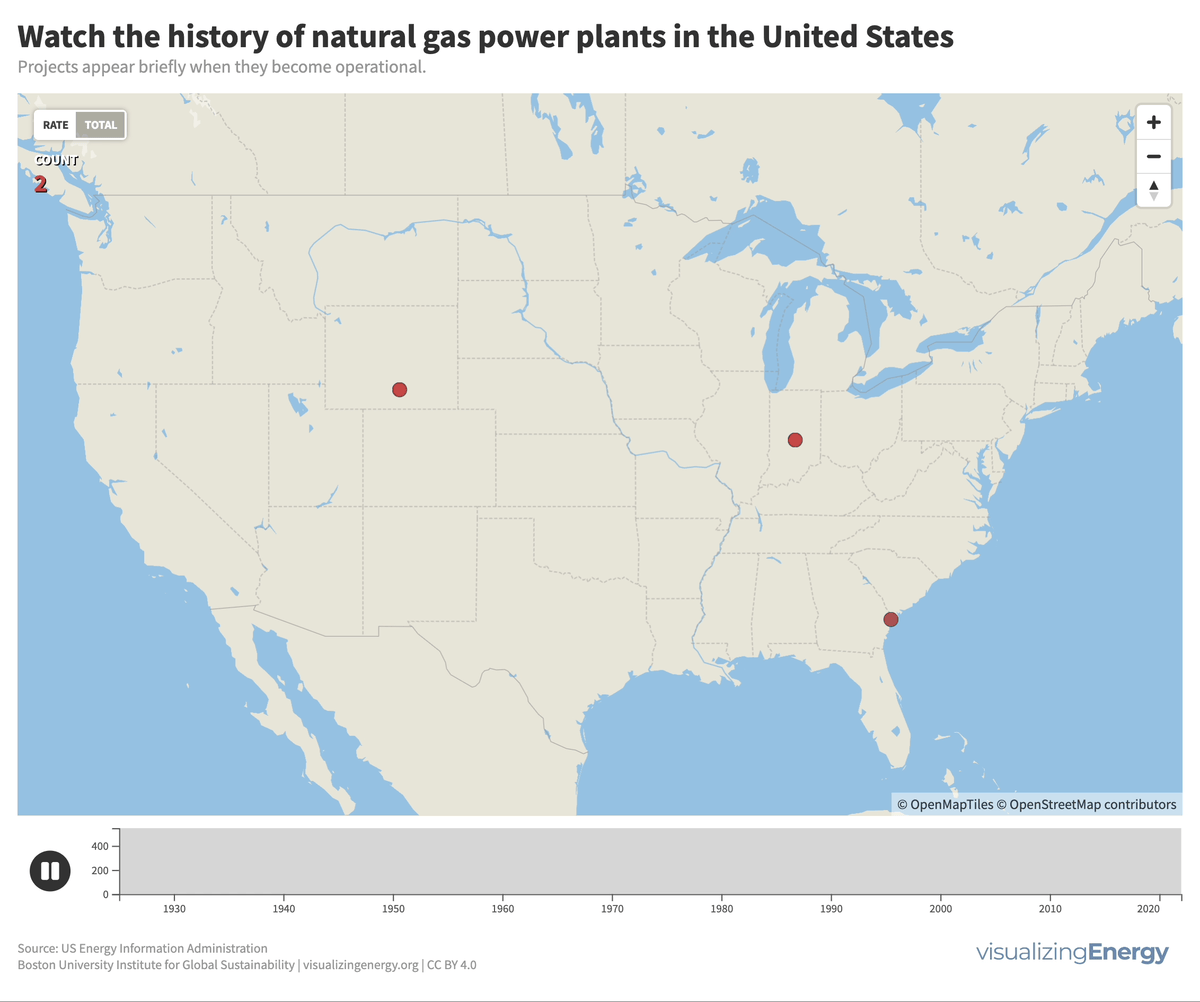
Since the 1920s, natural gas-fueled power plants grew gradually. After WWII, advancements in technology and fracking increased US electricity generated by natural gas from 16% in 2000 to 38% in 2021.