
Does more energy use lead to greater life satisfaction?
While higher incomes generally lead to greater life satisfaction, it’s not a guarantee. People in countries with high life satisfaction tend to use more energy, which can enhance comfort and mobility. Modest increases in energy use can significantly improve life satisfaction, but there are diminishing returns at higher levels.
Health impacts from oil and gas production in the United States

Oil and gas activities contribute to significant air pollution, resulting in adverse health effects and economic costs. Emissions from drilling, production, and transportation release pollutants that are linked to asthma, heart attacks, and premature deaths, especially impacting vulnerable populations. Addressing these emissions is crucial for protecting public health, mitigating economic burdens, and implementing comprehensive policies to reduce air pollution from the oil and gas industry.
Long run consumption and price of energy services in the United Kingdom
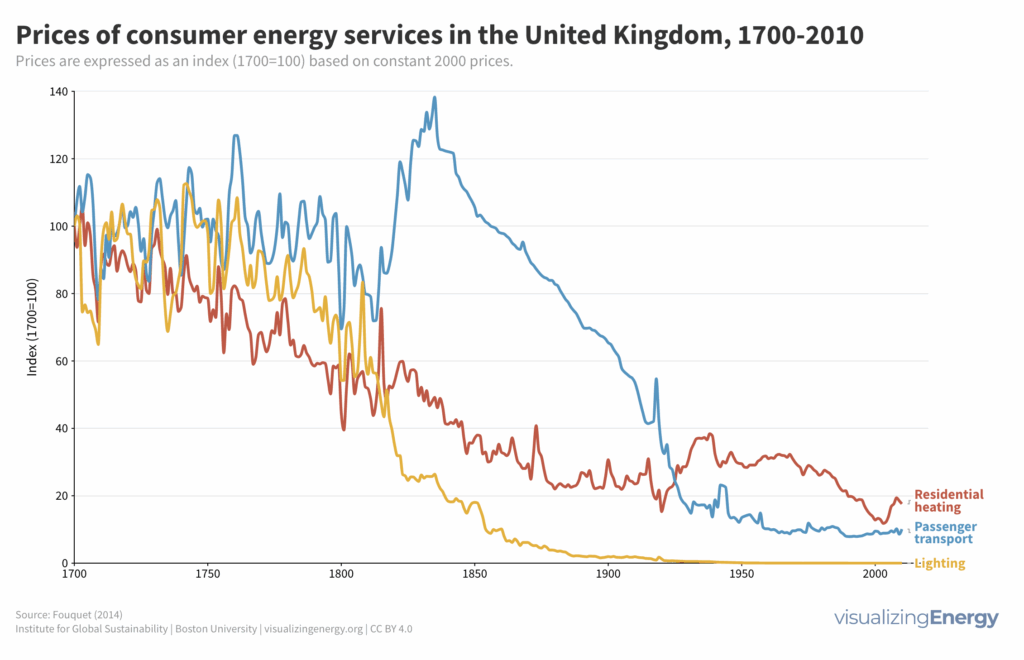
Roger Fouquet’s research on the United Kingdom highlights the remarkable growth in energy consumption over centuries. Factors like fuel shifts, improved efficiency, and changing preferences drove the increases. However, efficiency gains led to the rebound effect, where saved energy was partly offset by increased consumption.
Bitcoin’s energy and carbon footprint
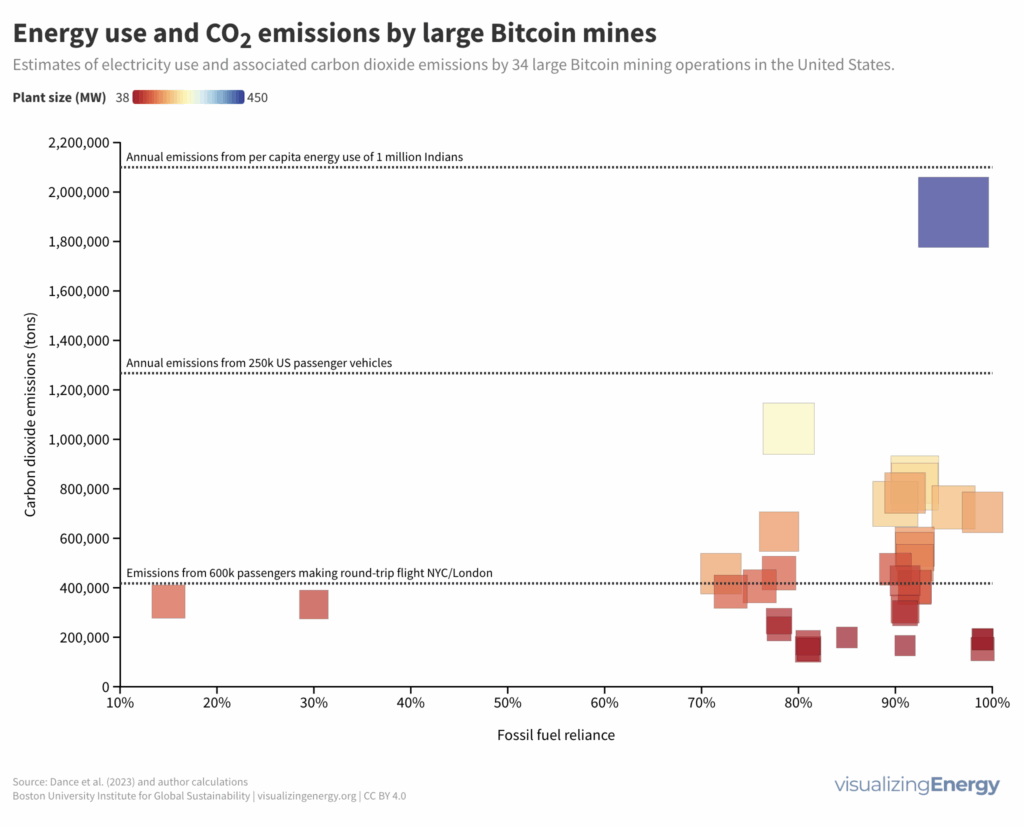
Cryptocurrencies like Bitcoin rely on blockchain technology and crypto mining, which consume massive amounts of electricity and have significant carbon footprints. The lack of transparency and regulation in the industry raises concerns about the economic, social, and environmental costs associated with crypto mines.
Explore world solar power capacity added in 2020

In 2020, 437 new solar electricity projects worldwide added a total capacity of 38,941 MW. The largest project was the 1348 MW Karapınar YEKA-1 solar farm in Turkey. Asia, North America, and Europe were the main contributors to solar capacity, with China leading with 23% of the global additions.
Explore the world history of nuclear reactors, 1951-2022

Explore the global history of nuclear reactors from 1951 to 2022. This visualization showcases 626 operational reactors, highlighting the dominance of pressurized light water reactors (PWRs). Different reactor types exhibit geographic patterns, with retired reactors and ongoing upgrades observed in various countries. The average age of reactors in the United States was 41 years in 2021.
Seventy-five years of world uranium production and resources
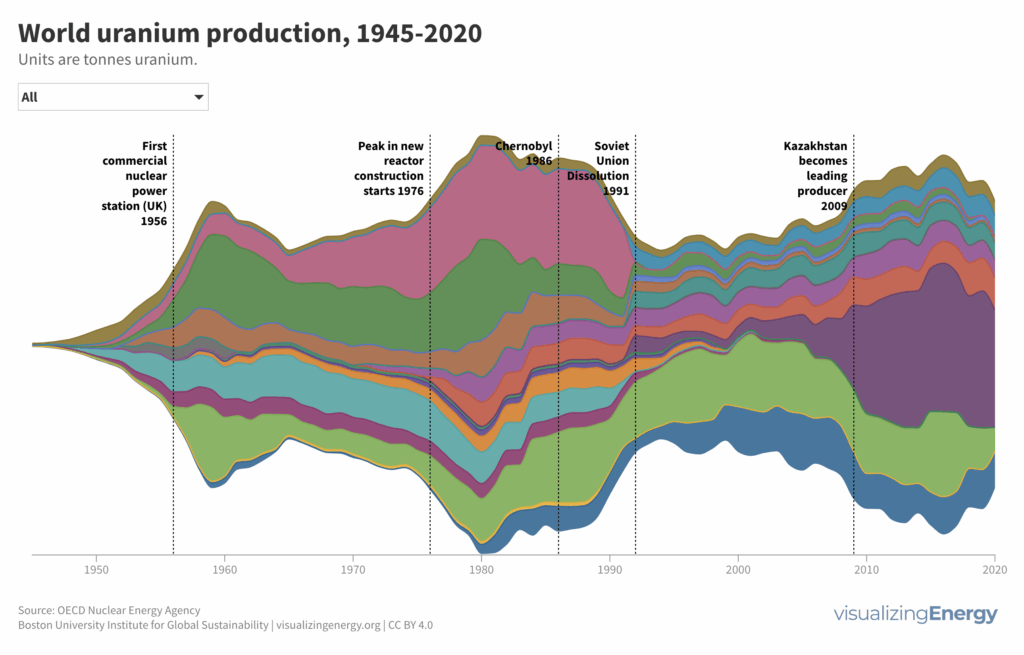
Uranium is crucial for nuclear power generation, supplying 10% of global electricity. The largest recoverable uranium resources are held by Australia, Kazakhstan, Canada, Russia, and Namibia. Major uranium consumers rely on imports due to limited domestic production, leading to significant international trade in uranium products.
Explore world wind power capacity added in 2020

In 2020, 938 new global wind projects added 75,812 MW, with the largest being the 1200 MW Hornsea offshore wind farm. Over 90% of new capacity came from onshore wind farms (76 MW average), while offshore farms averaged 283 MW.
Coal mine superemitters of methane
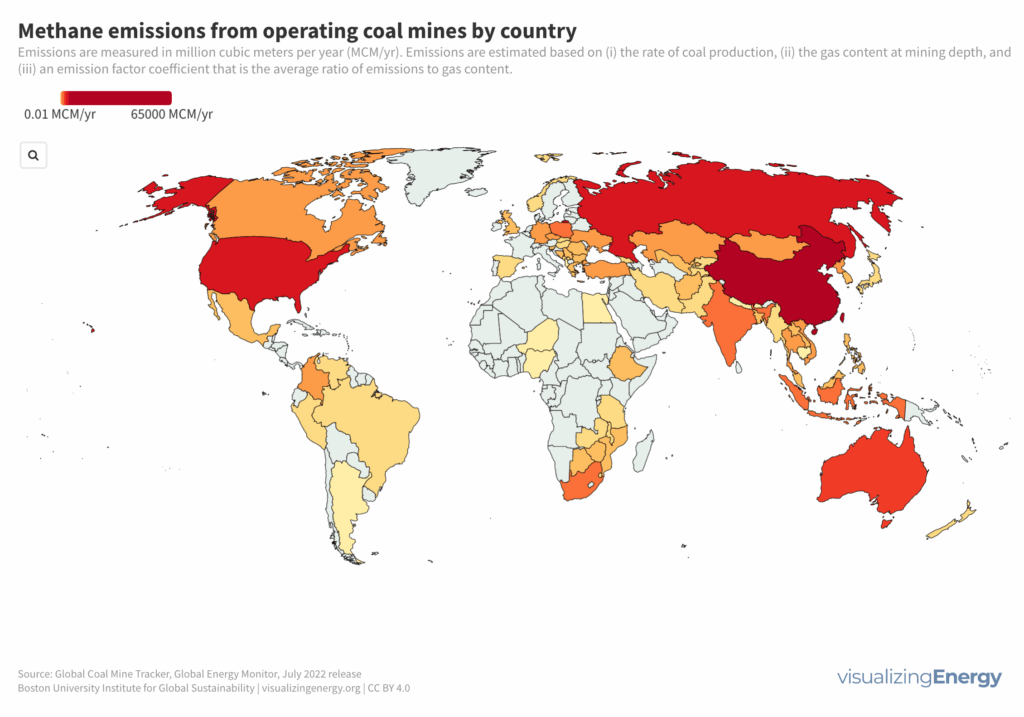
Methane emissions from coal mines are a significant concern for greenhouse gas reduction. Certain mines, known as “superemitters,” contribute a large proportion of global methane emissions. Factors like mine depth and coal rank affect methane content. While reducing coal use in electricity generation is important, mitigating methane emissions from mines needs greater attention.
United States energy history in two charts
The United States has experienced a substantial increase in energy consumption over time, driven by factors like population growth and technological advancements. The transition from forests to coal, followed by oil and natural gas, has shaped the country’s energy sources. However, fossil fuels still dominate energy use, highlighting the need for a rapid shift towards renewable and low-carbon alternatives.