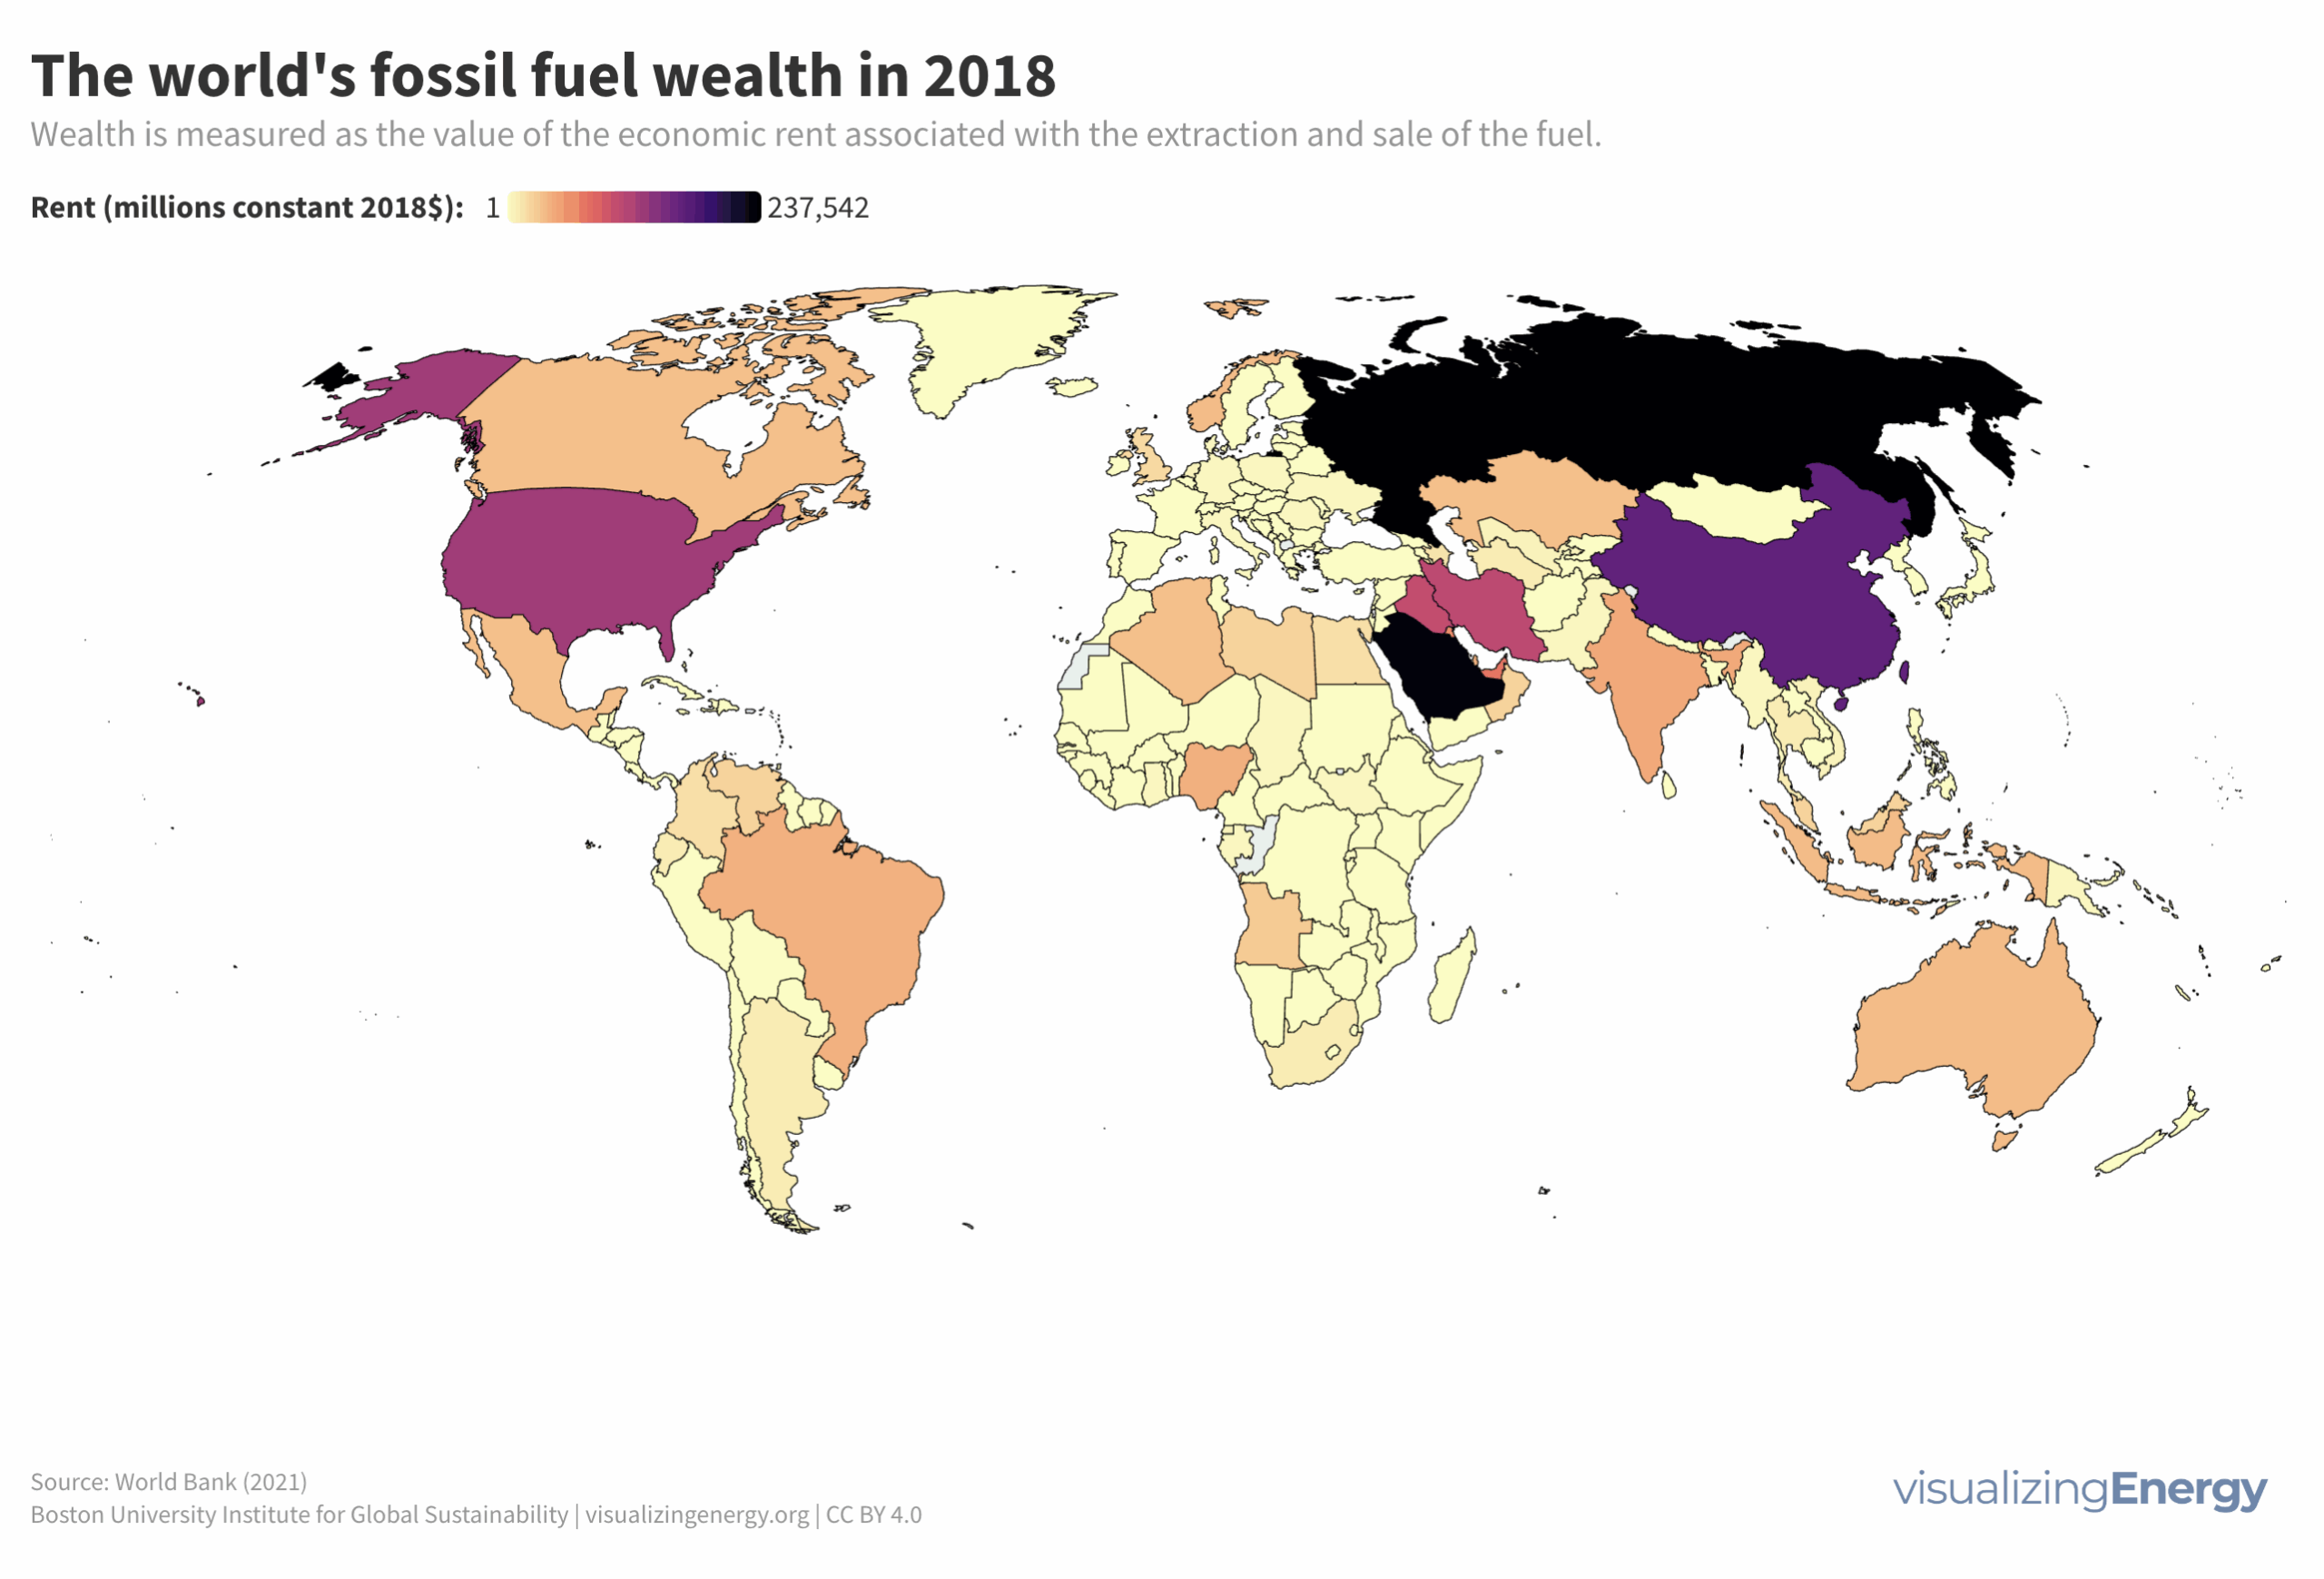
What nations profit the most from fossil fuel extraction?
The well-being of a nation’s population is determined in part by how the nation’s wealth is managed. Wealth has two principal components. The first is

The well-being of a nation’s population is determined in part by how the nation’s wealth is managed. Wealth has two principal components. The first is
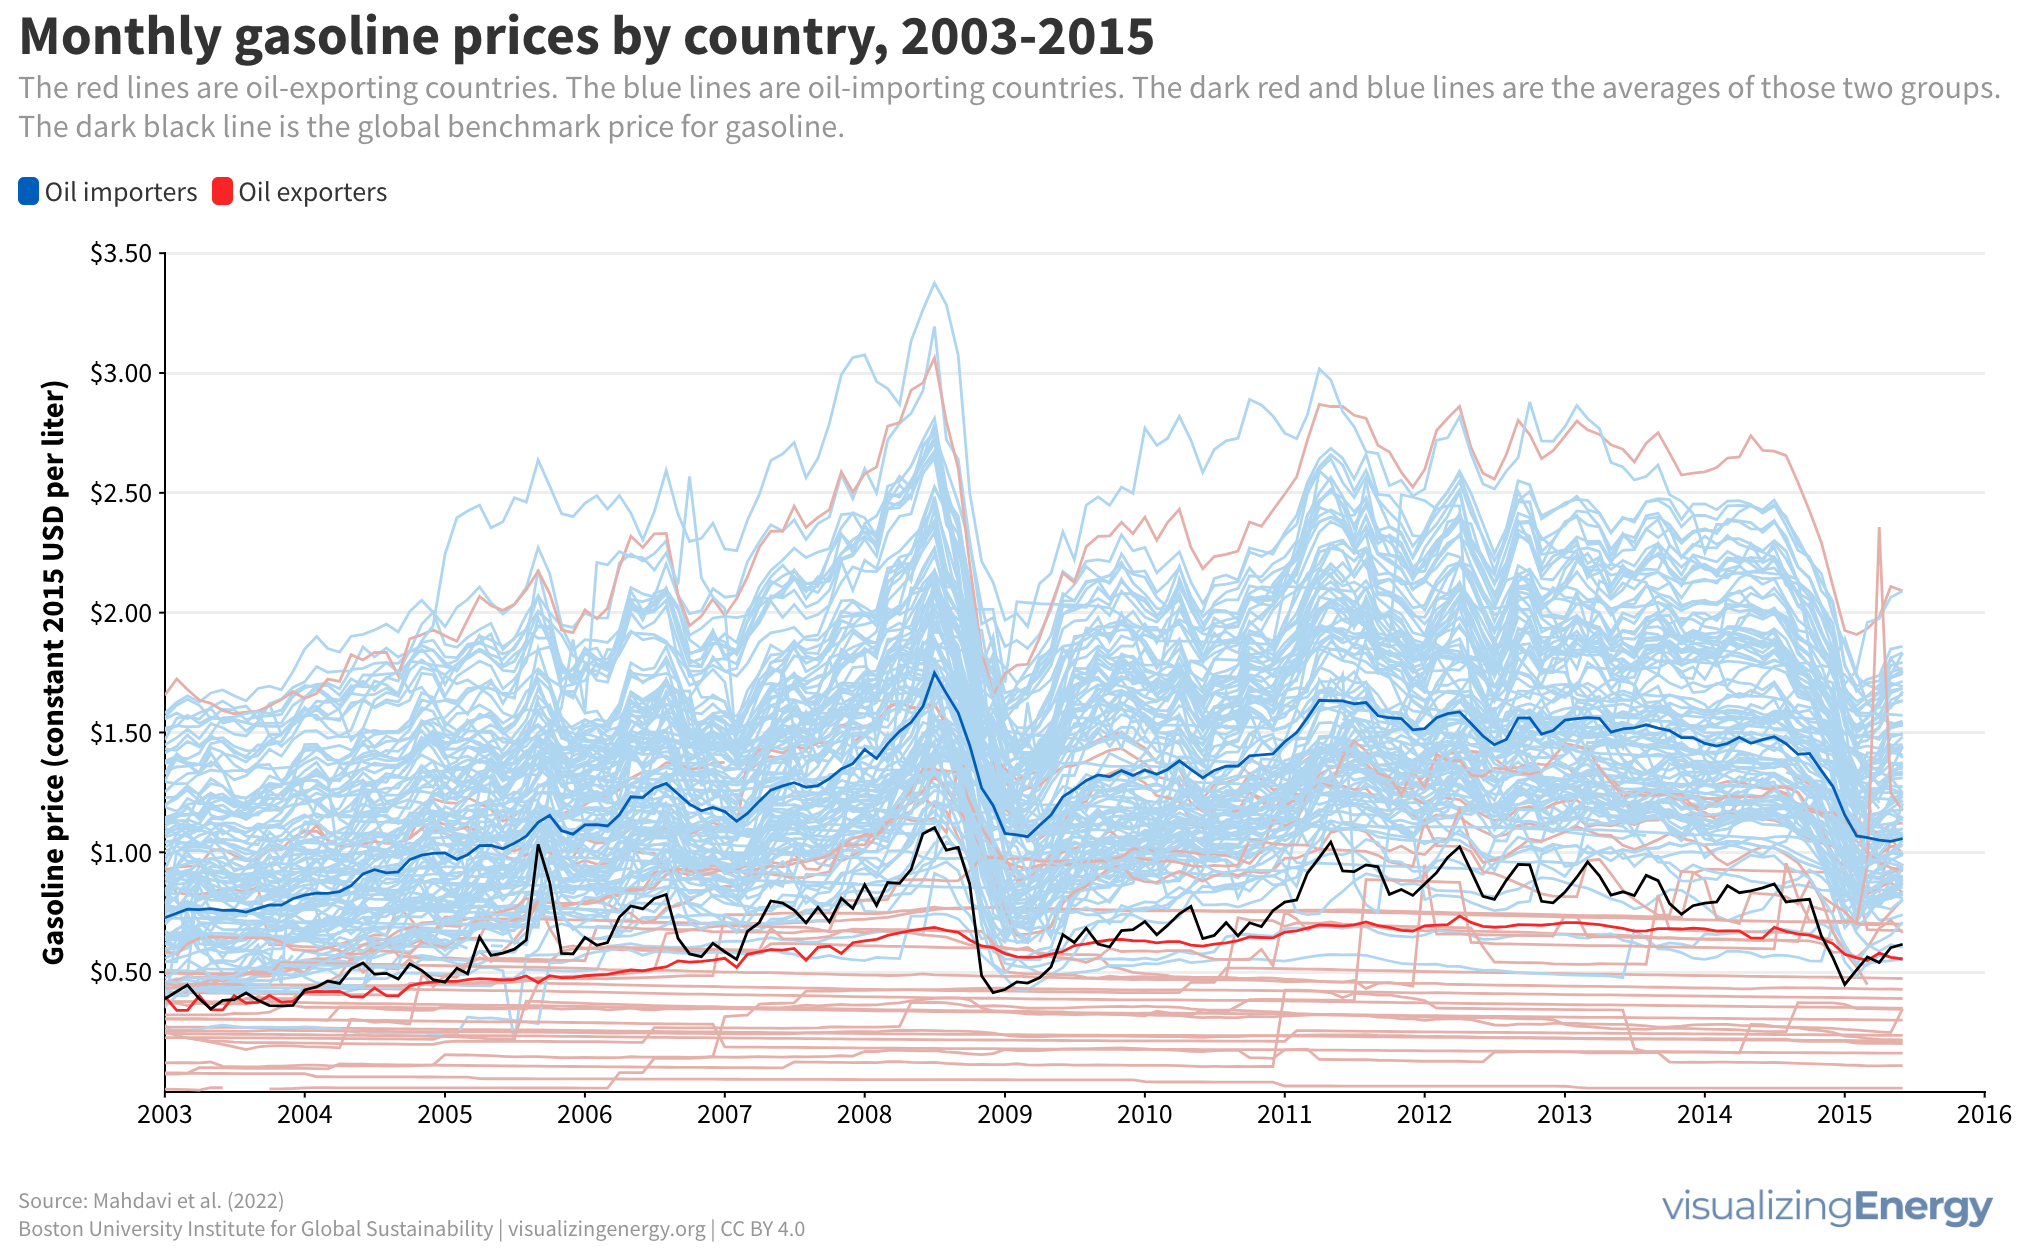
Government policies significantly influence gasoline prices, leading to disparities across countries. Most nations tax gasoline, while some subsidize it, especially oil exporters. Higher income countries typically impose steeper gasoline taxes to harness revenue. There’s a growing call to reduce fossil fuel subsidies to curtail greenhouse gas emissions, advocating for carbon pricing to promote clean technology.
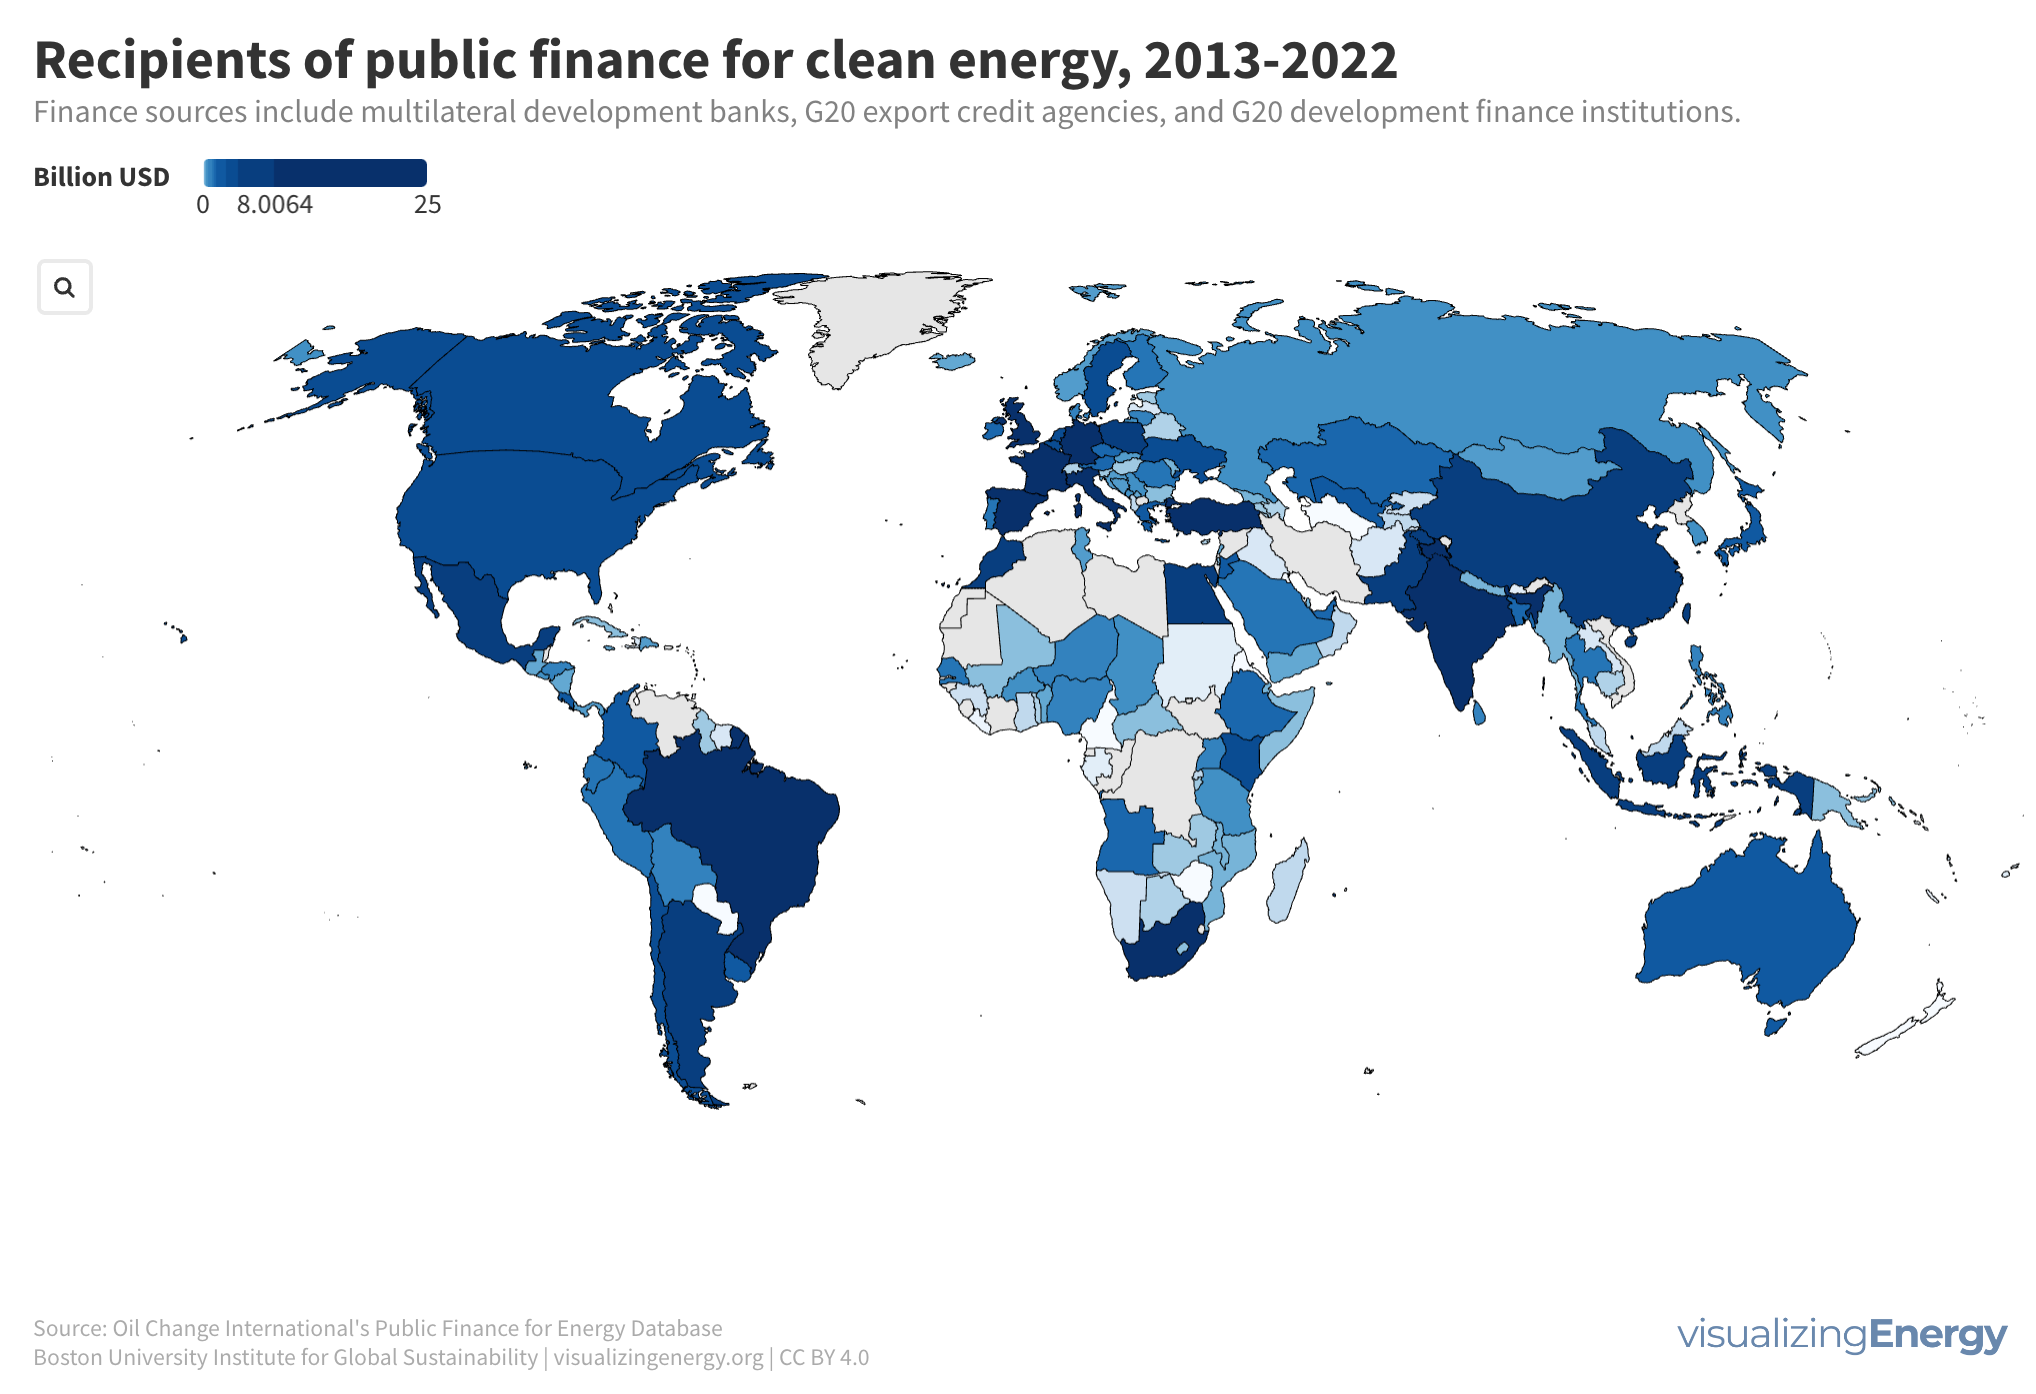
The global energy system encompasses diverse infrastructure requiring extensive investment, with USD 2.8 trillion spent in 2023. Public finance significantly supports energy projects, where fossil fuels received 56% of funding from 2013 to 2022. Clean energy finance increased until 2021, highlighting varying regional priorities and the dominance of large projects in funding distribution.
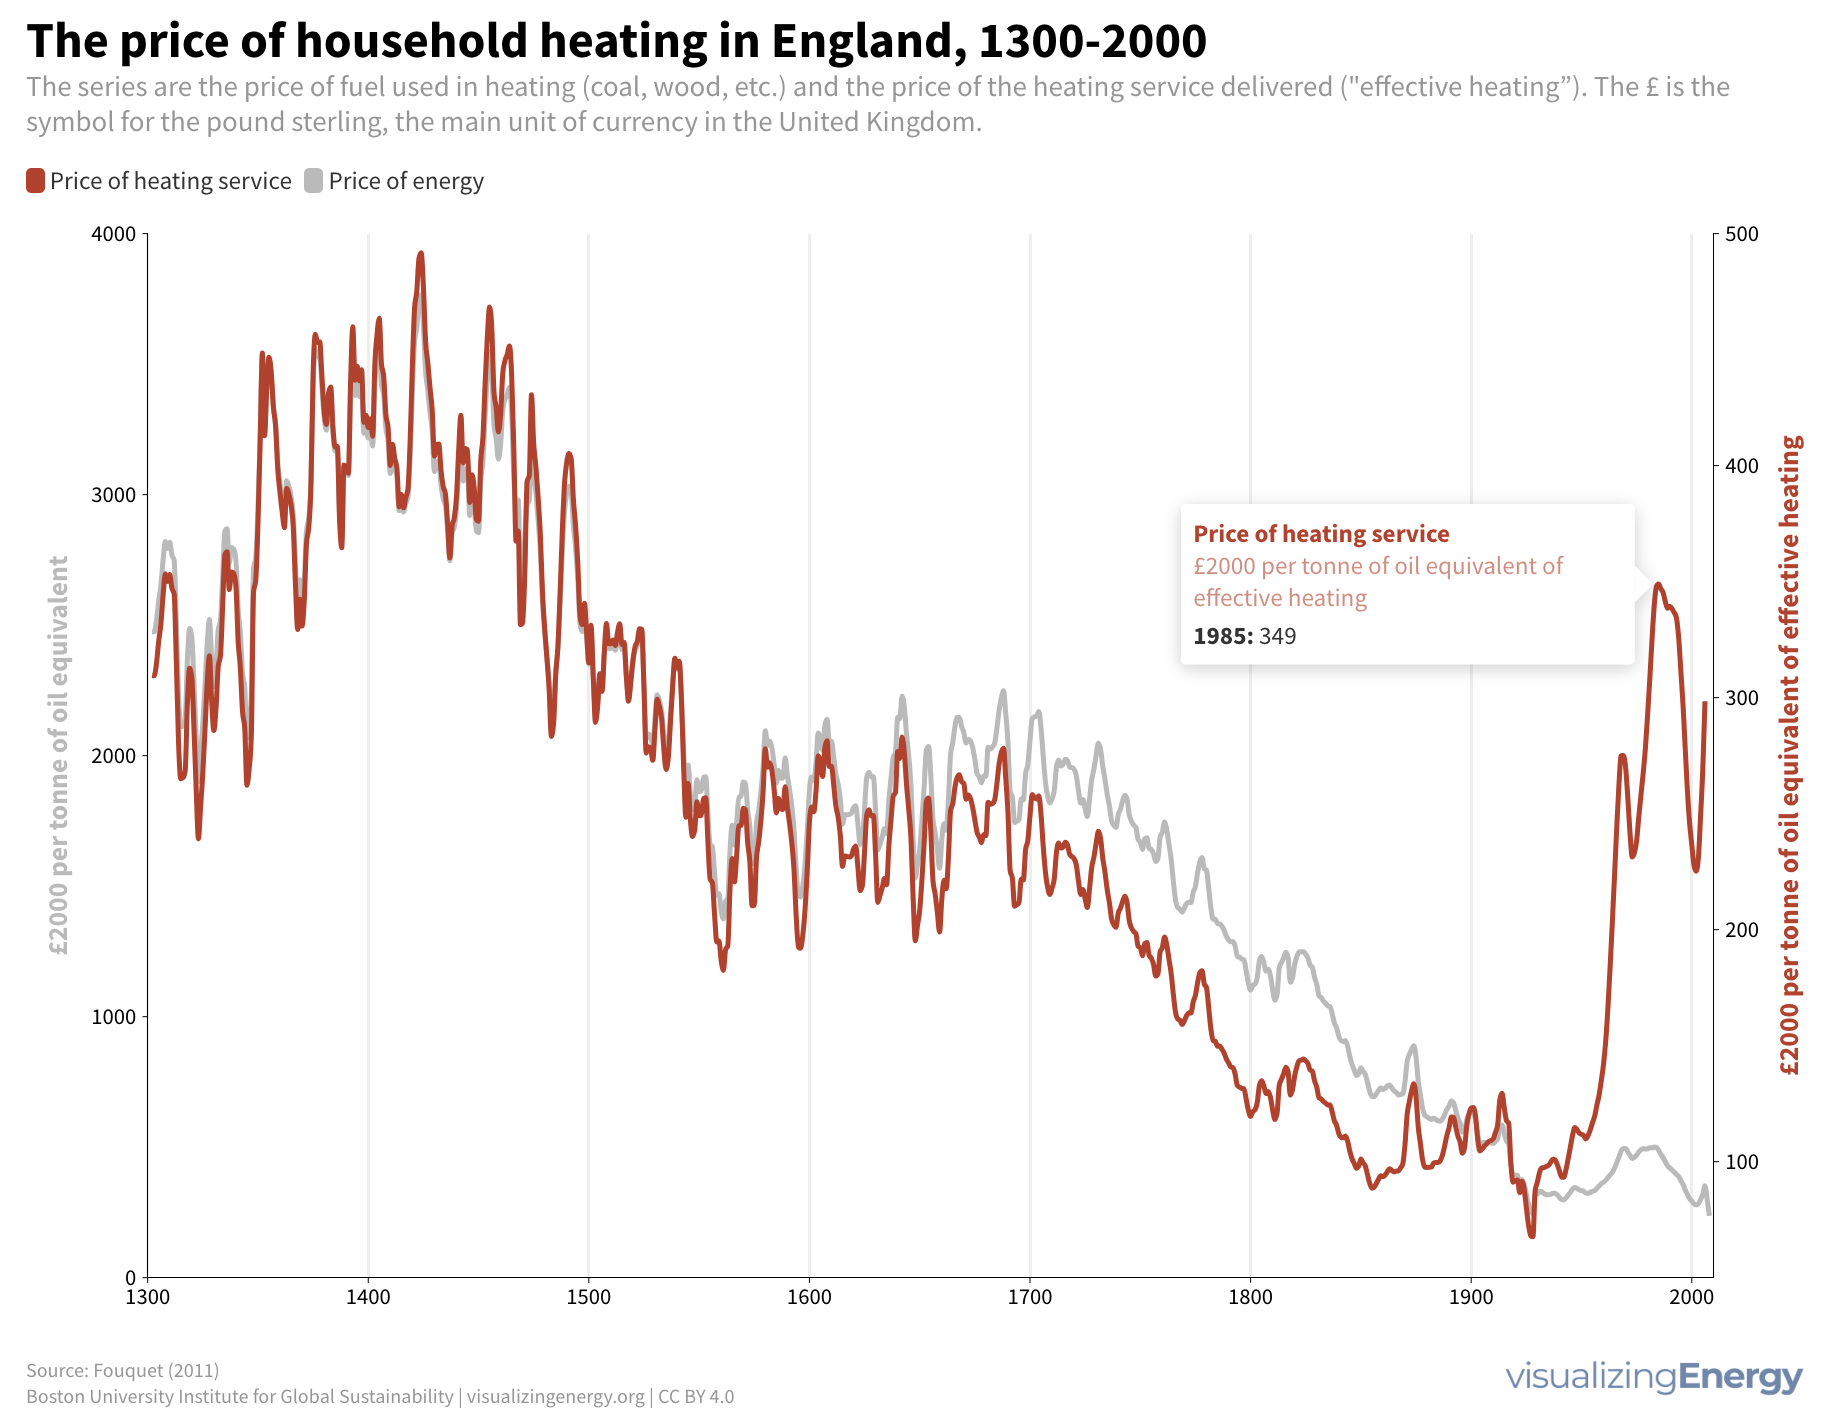
Energy historian Roger Fouquet’s analysis of historic energy transitions in household heating in England from 1300 to 2000 reveals interesting trends. The shift from wood to coal and later to natural gas resulted in fluctuations in fuel prices. Despite the increase in energy costs, improvements in technology and air quality led to a significant decrease in the price of heating services by 2000.

Global oil and gas consumption increased by 14% from 2013 to 2023, posing a challenge to limiting global warming. JP Morgan Chase led in financing upstream oil and gas activities, providing over USD 67 billion to various companies. Concerns were raised about banks’ commitment to reaching net zero emissions and prioritizing policies allowing the purchase of carbon offsets, which may promote greenwashing. Some oil and gas companies have weakened their commitments to reduce investment in upstream projects.

Electricity plays a crucial role in modern society, constituting 21% of energy use in the EU in 2022 and expected to grow due to initiatives in transportation and heating. The 220 largest electricity companies globally represent about 3% of the total market cap of publicly traded companies. This industry is highly concentrated, with just five companies holding 20% of the market cap.
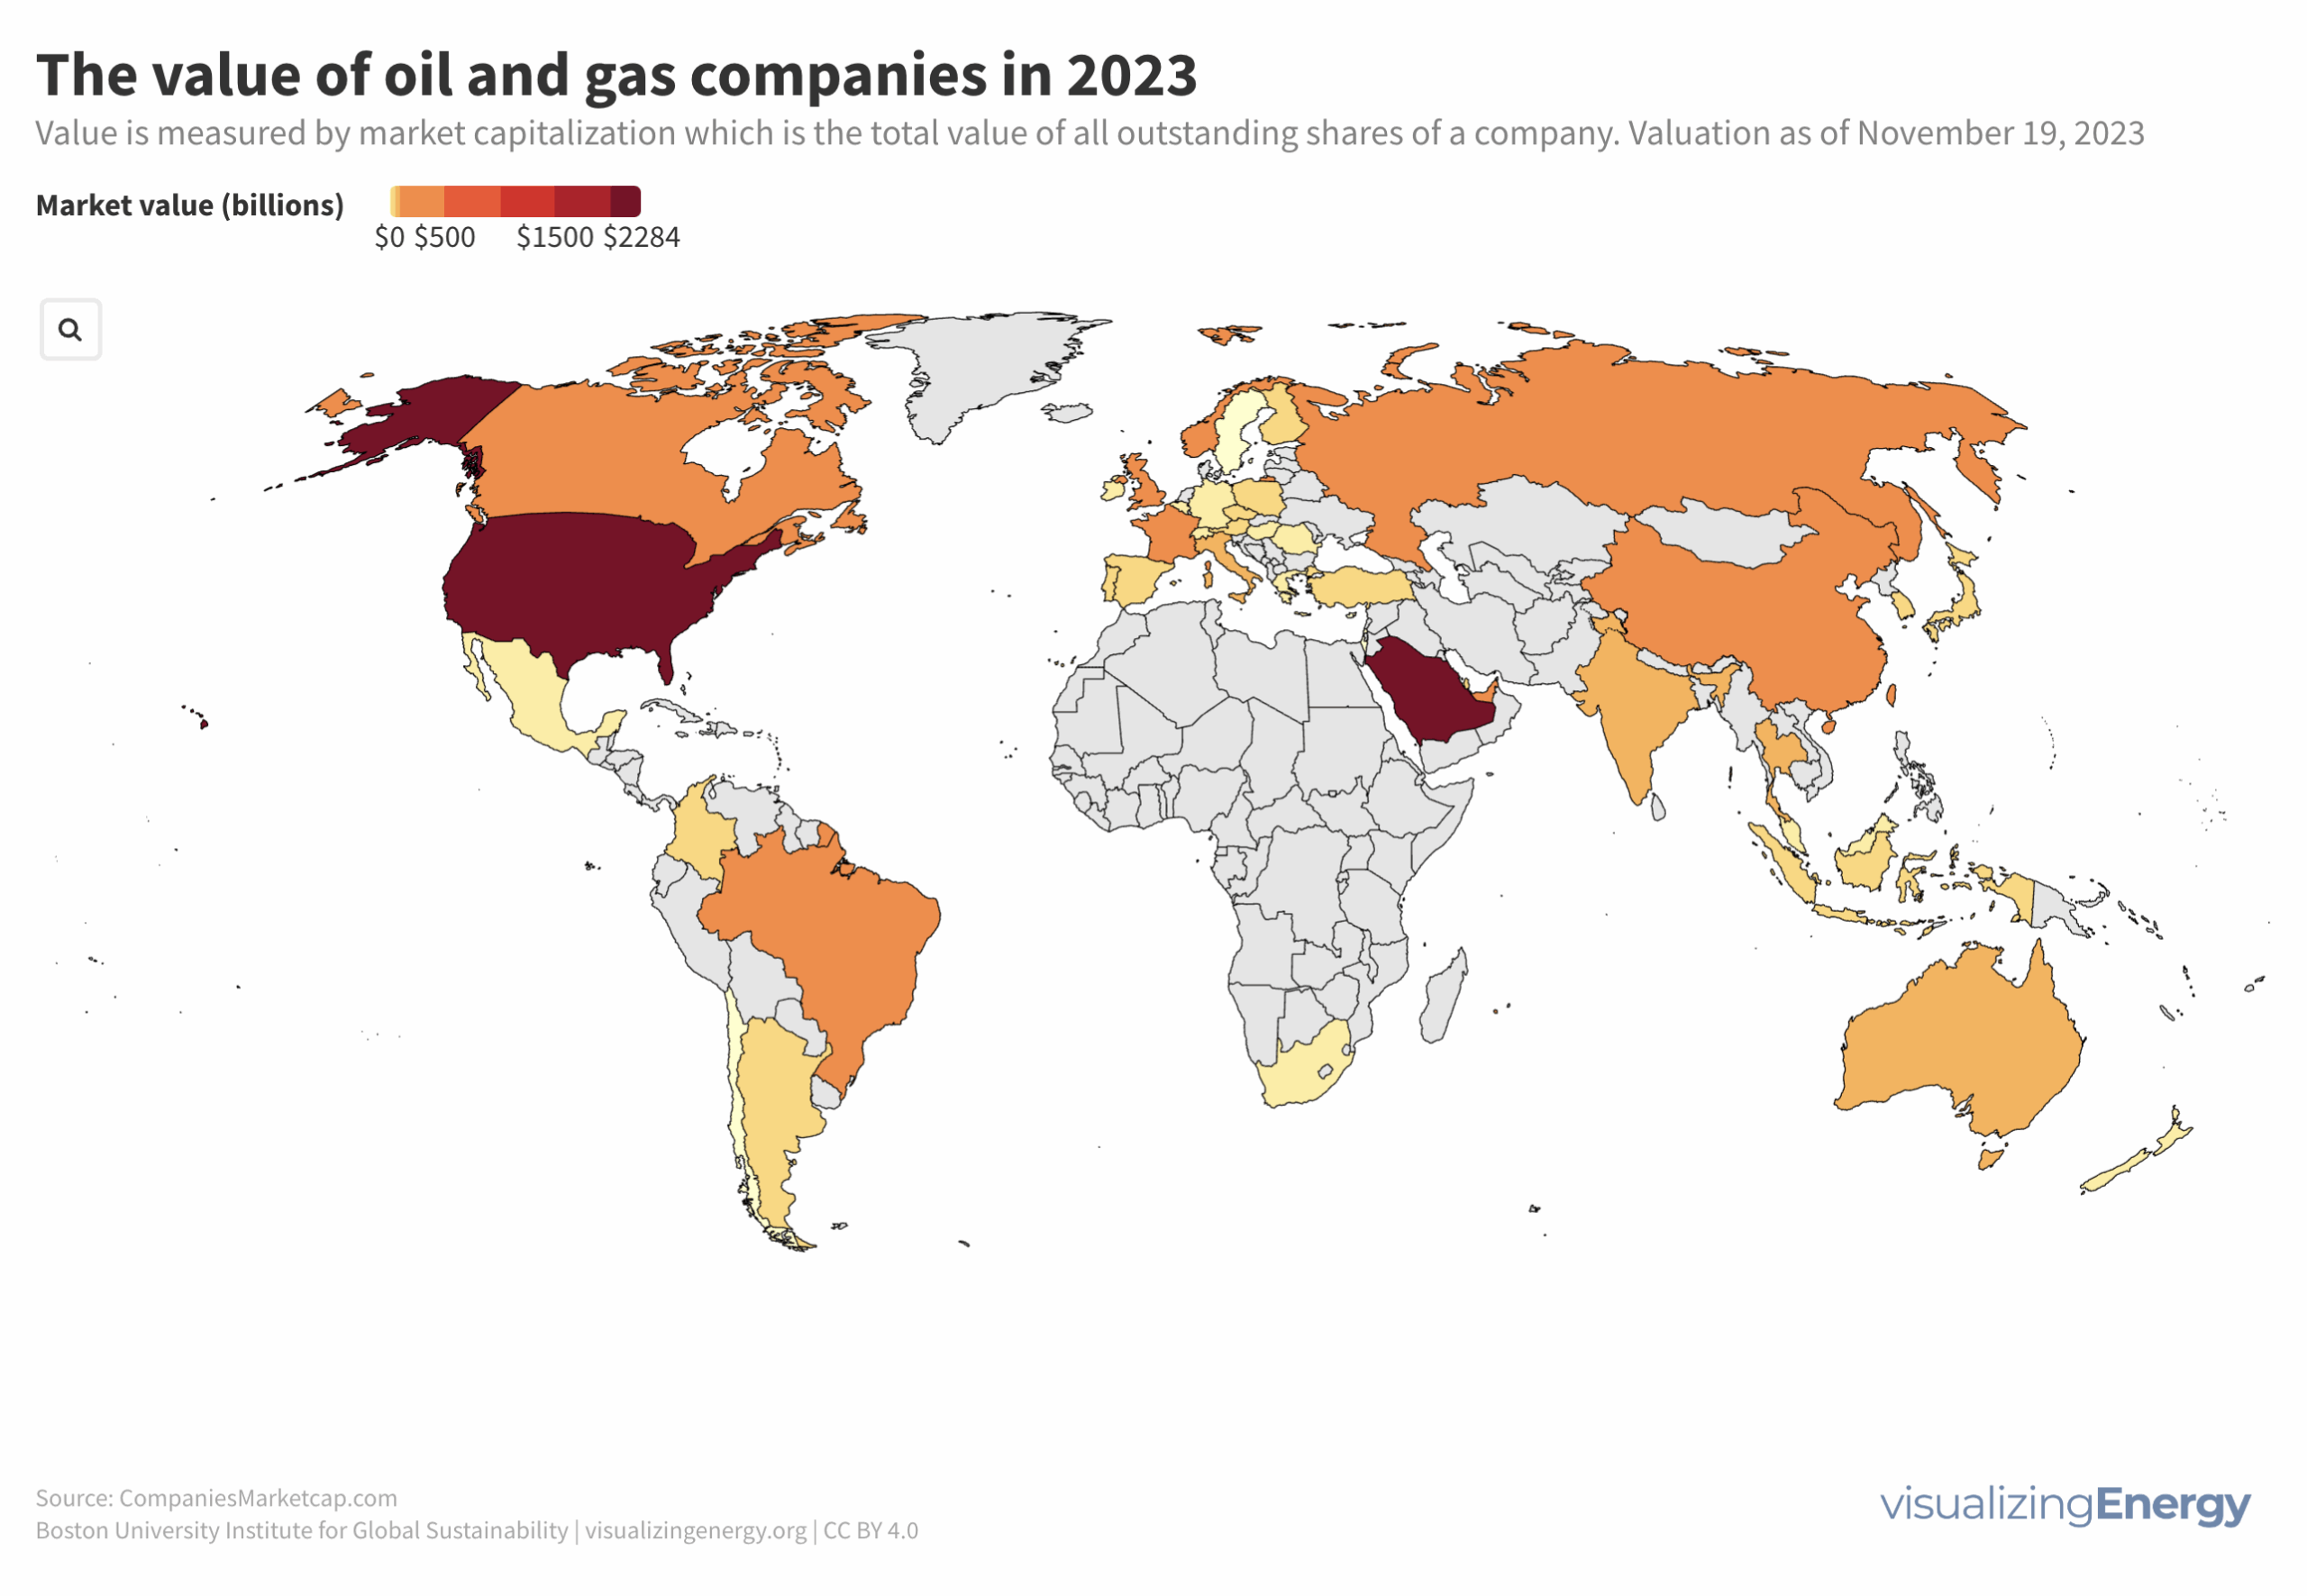
Oil and natural gas make up 55% of global energy use, with the top 350 companies holding a combined market cap of $7.2 trillion, comprising 7% of the world’s largest companies. State-owned enterprises control 90% of the world’s crude oil reserves. Just 8 companies hold 50% of the market cap.
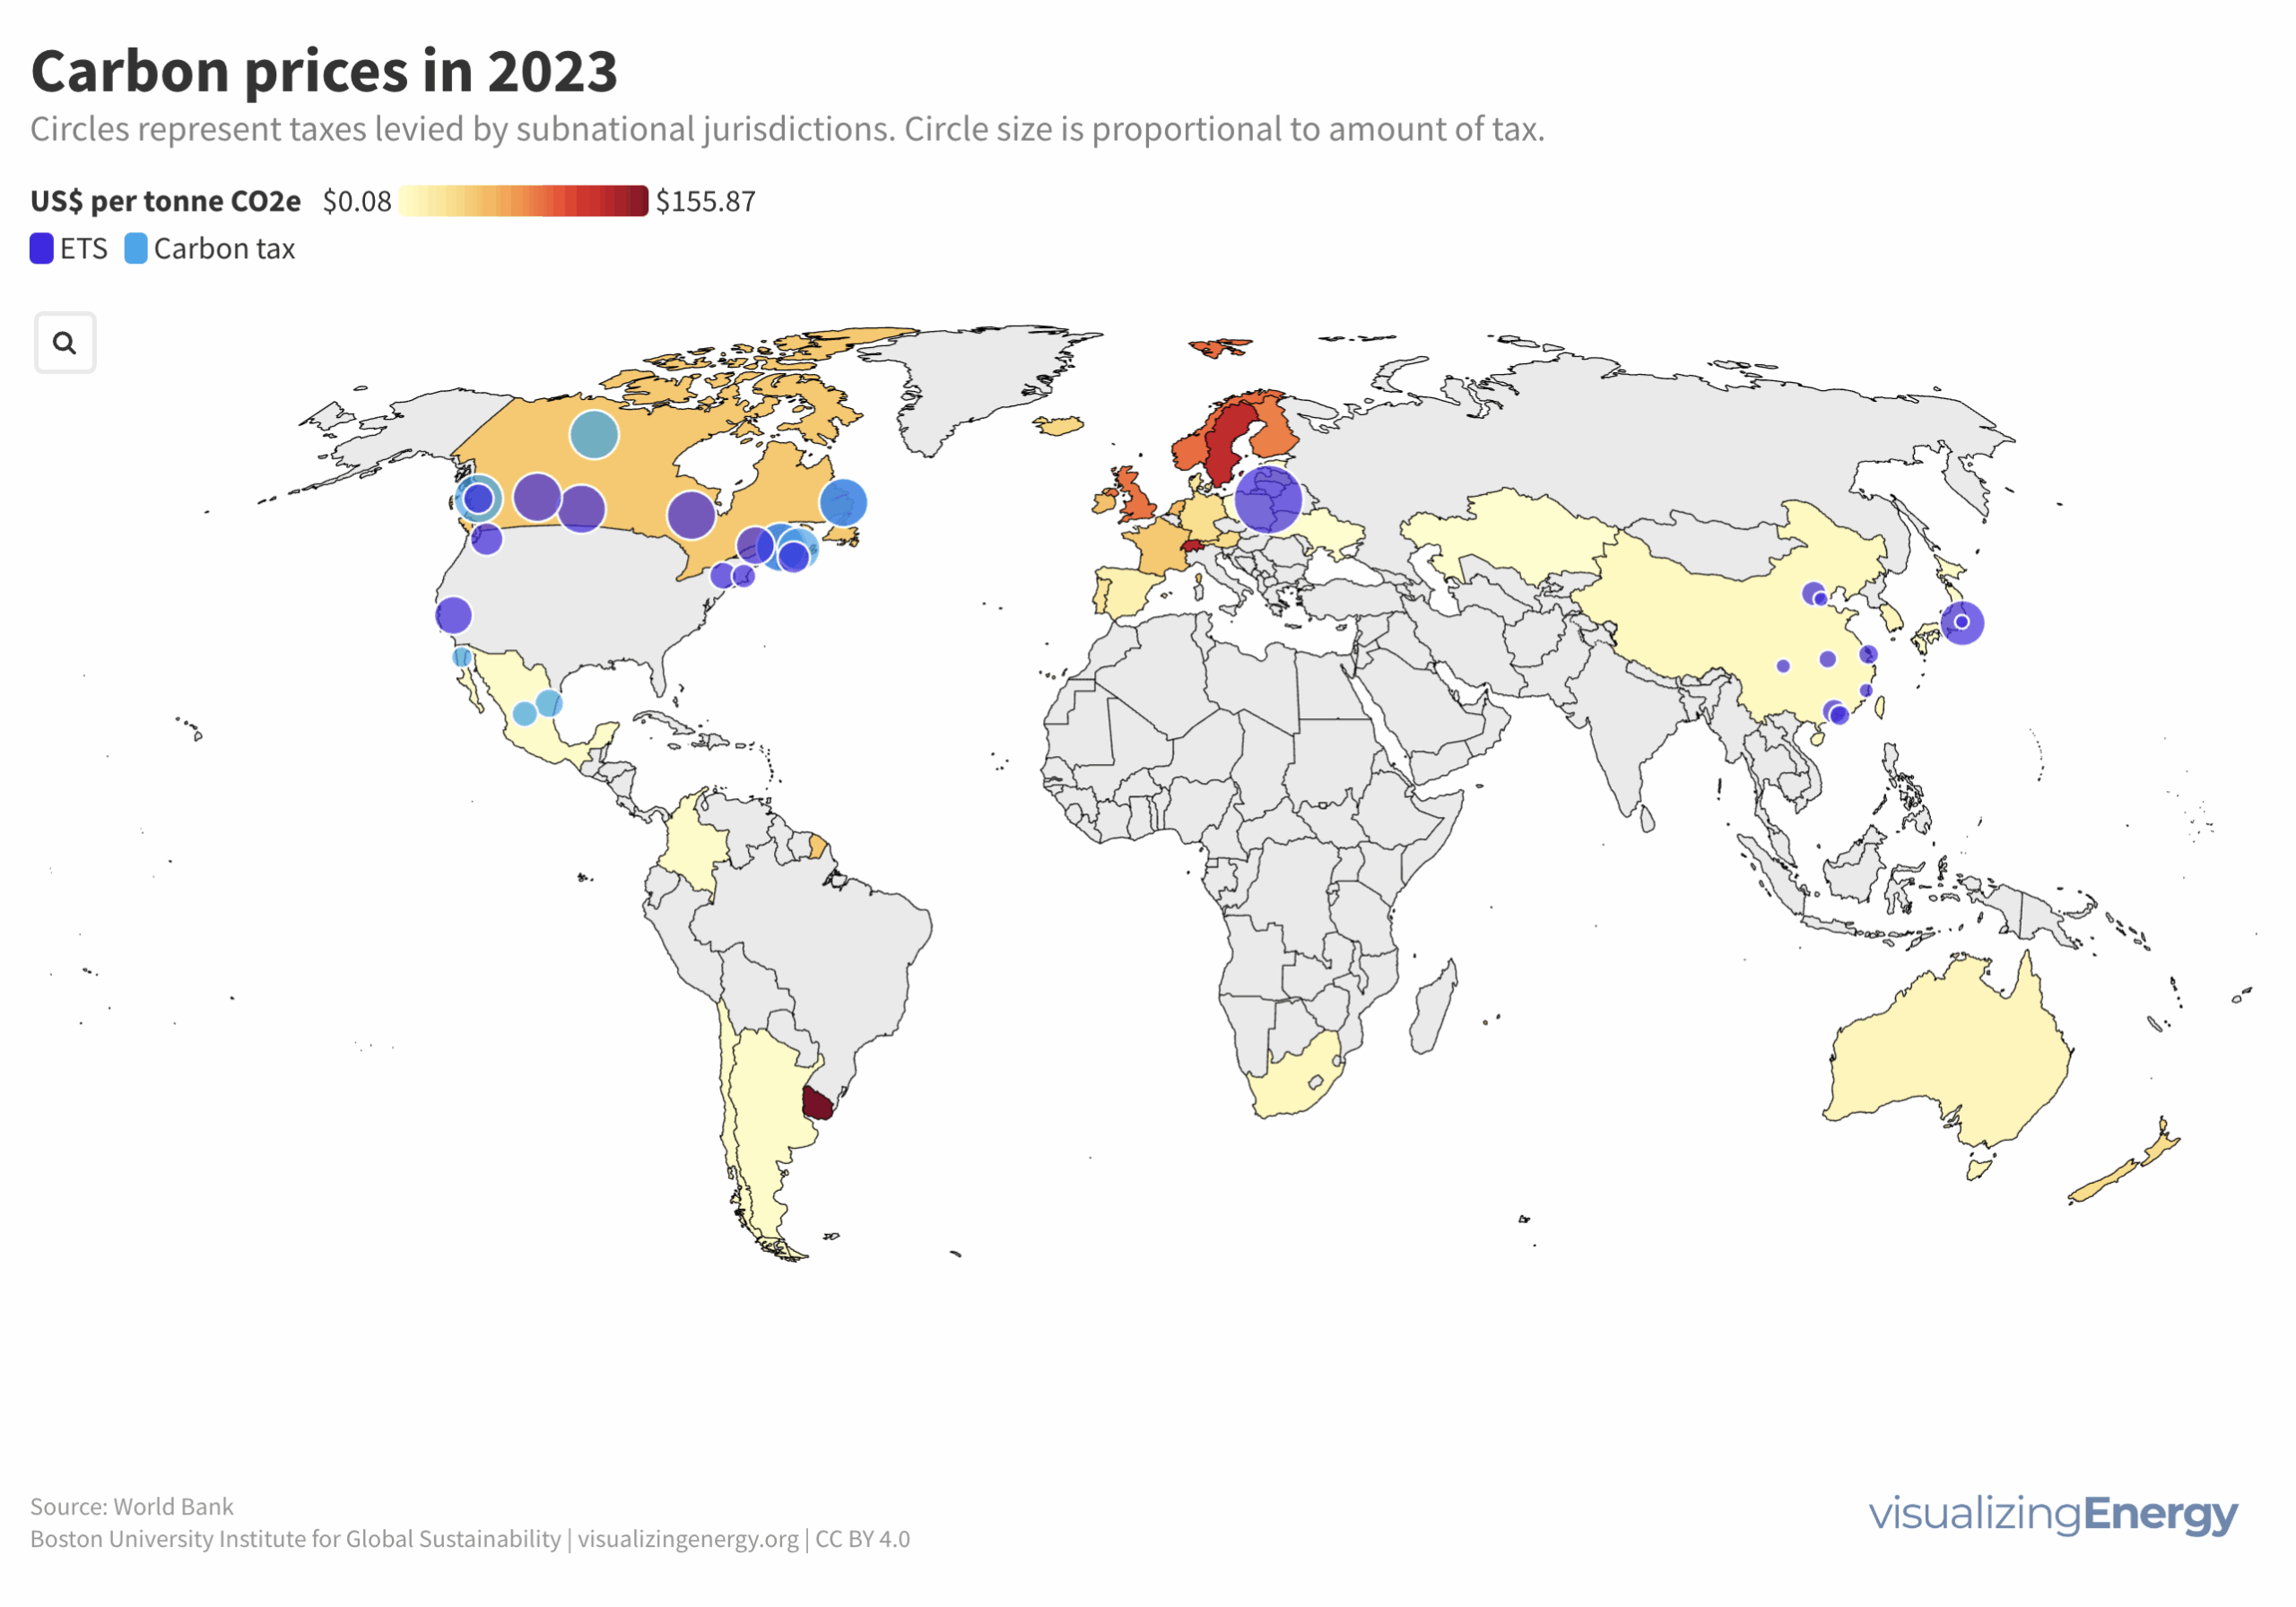
Many experts advocate for “putting a price on carbon” to reduce greenhouse gas emissions and address climate change. This involves capturing the external costs of emissions and linking them to their sources through a price. Approaches include emissions trading systems (e.g., “cap and trade”) and carbon taxes. Currently, 73 initiatives cover 23% of global emissions, with examples in South Africa and the European Union.
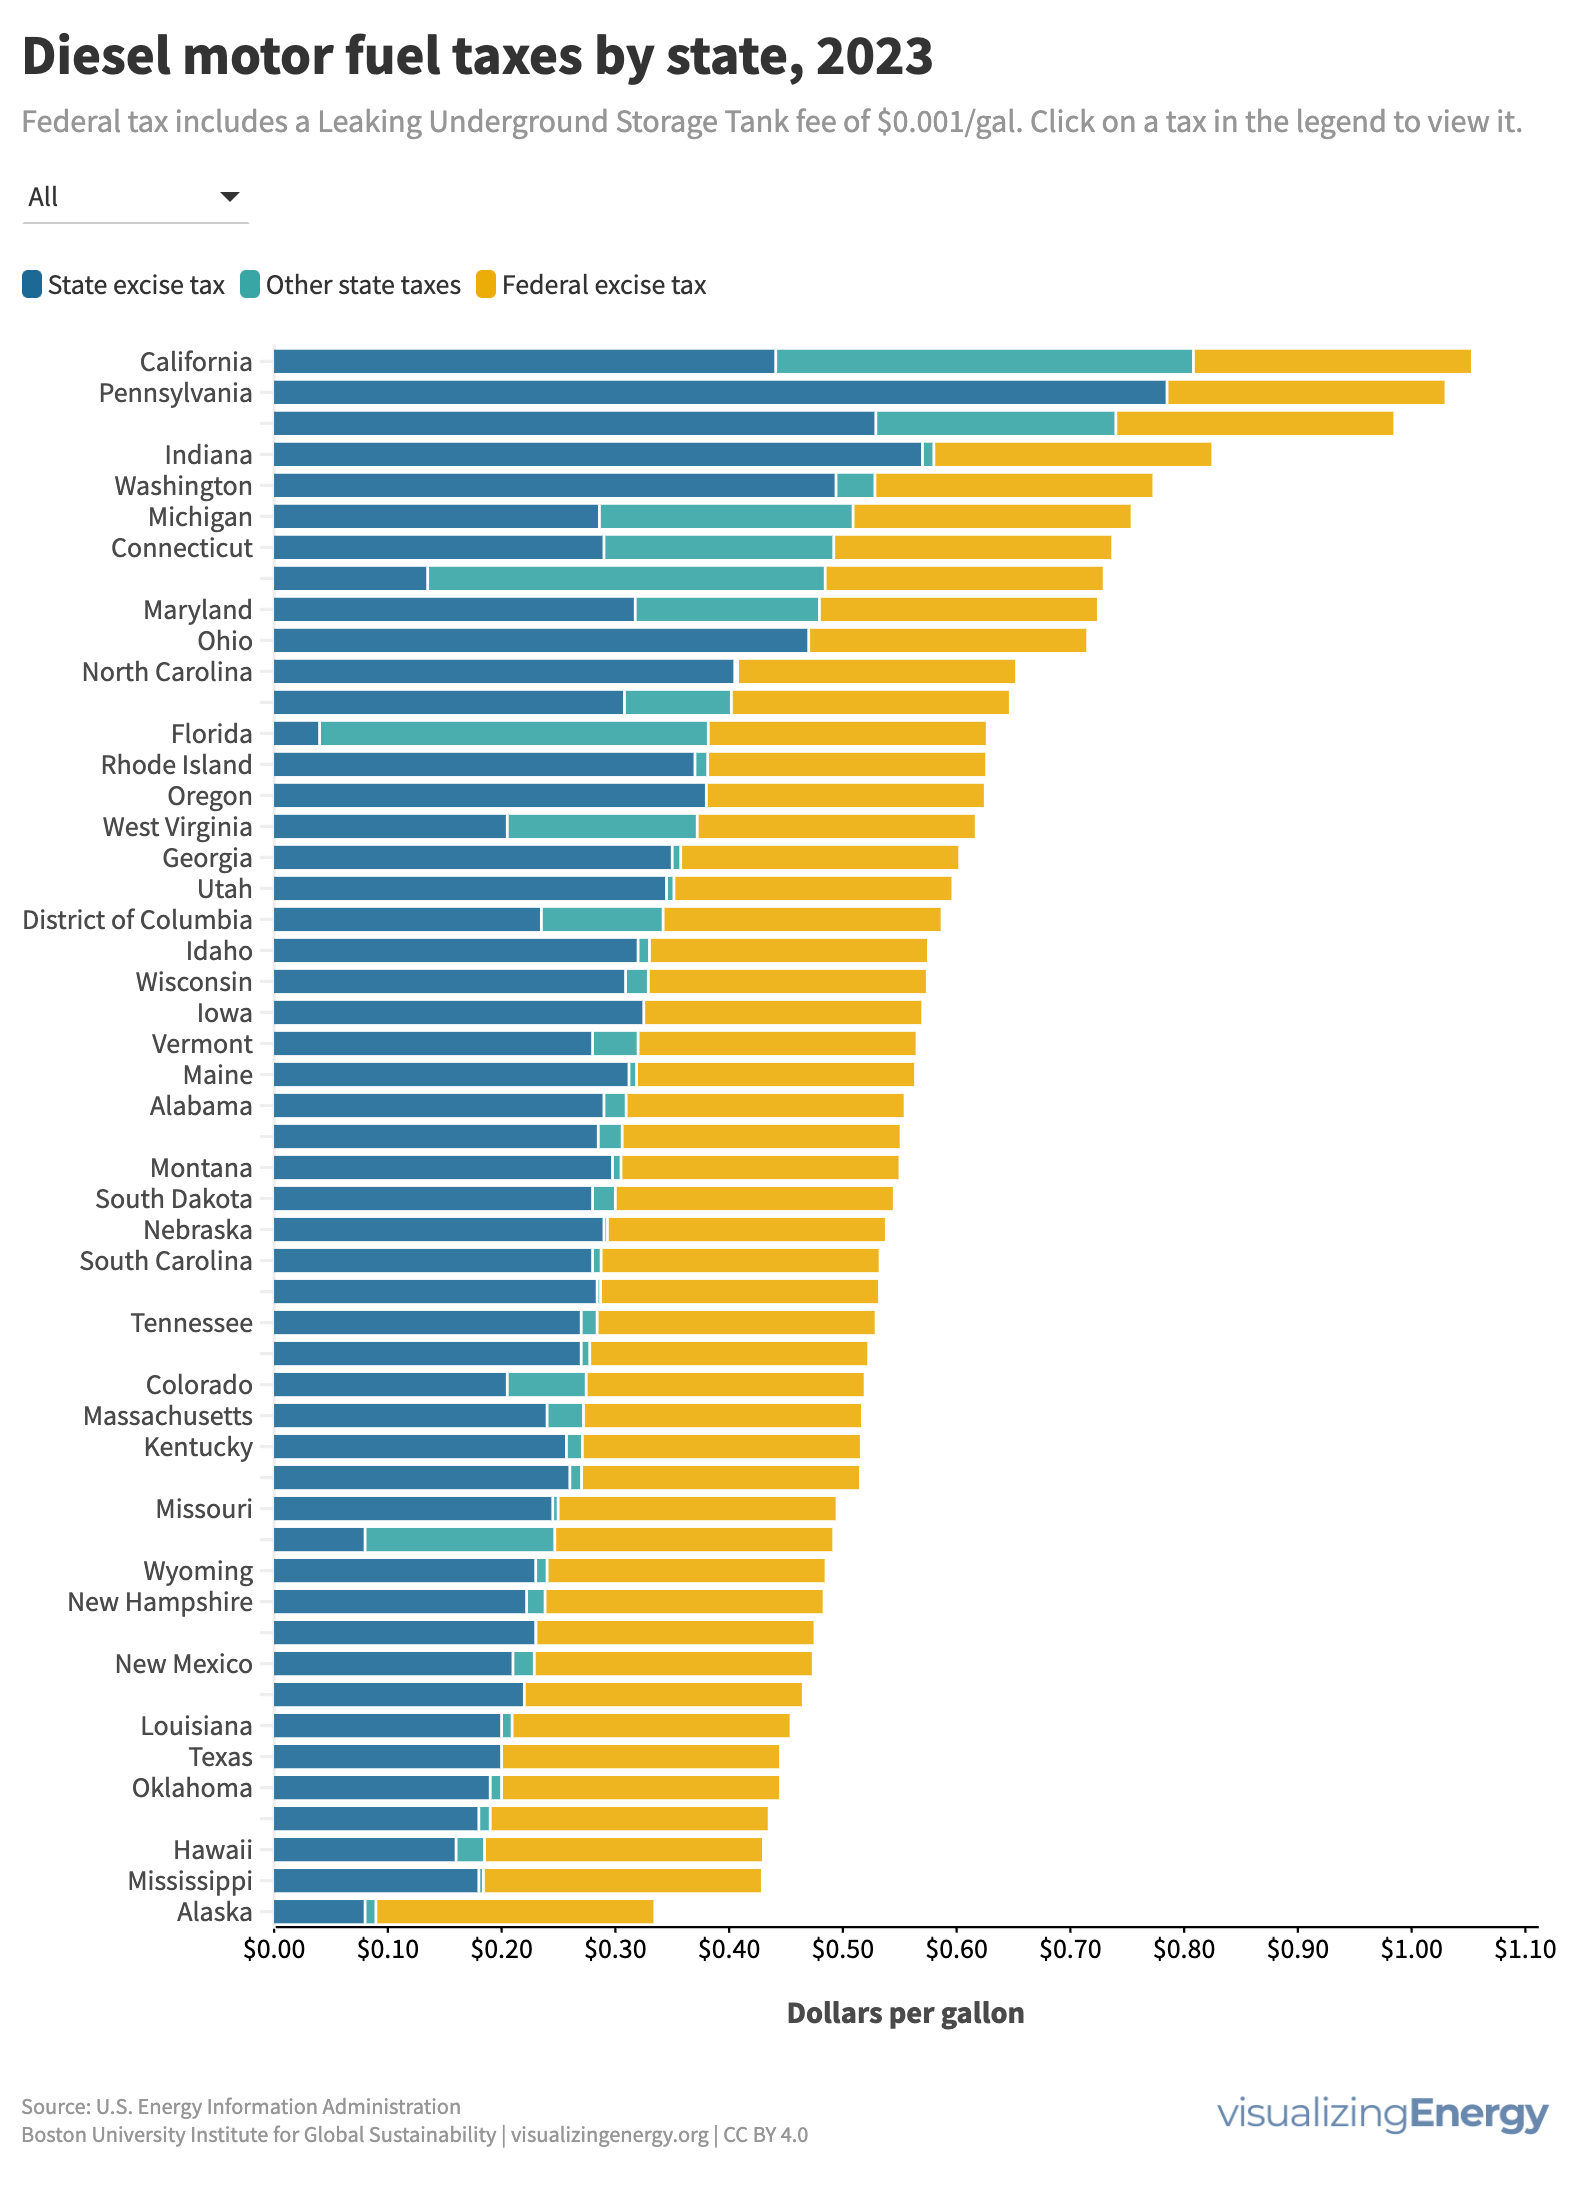
Americans closely monitor gasoline prices, viewing them as indicators of leaders’ success, economic health, and environmental policy effectiveness. The price of crude oil largely influences gas prices, yet federal and state taxes play a significant role. These taxes, popular due to revenue generation, heavily fund highway and mass transit spending.
The Principles for Responsible Investment (PRI) were launched in 2006 by a group of institutional investors and the United Nations to promote sustainable and responsible investment. It has over 5300 signatories in 80+ countries, holding more than $65 trillion in assets. However, there are criticisms about its voluntary basis and enforcement mechanisms.