
Watch the history of waste-to-energy power plants in the United States
Waste-to-energy (WTE) plants in the US burn municipal solid waste to generate electricity, contributing less than one percent of the total. Initially developed due to landfill space scarcity, the renewable classification is disputed due to non-biogenic waste. Few new facilities have been built since the 1990s due to opposition, high costs, and increased focus on recycling and waste reduction.
Where are the world’s most valuable electricity companies?

Electricity plays a crucial role in modern society, constituting 21% of energy use in the EU in 2022 and expected to grow due to initiatives in transportation and heating. The 220 largest electricity companies globally represent about 3% of the total market cap of publicly traded companies. This industry is highly concentrated, with just five companies holding 20% of the market cap.
Ethanol in the United States
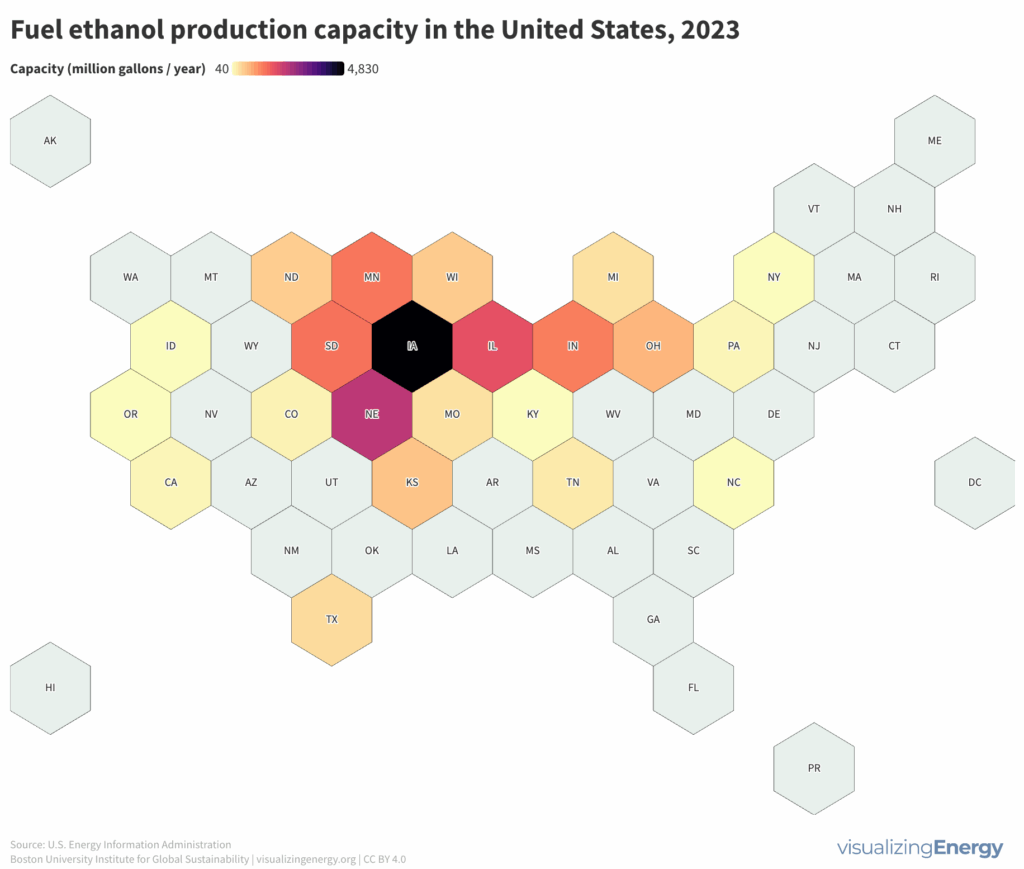
Henry Ford’s early vehicles ran on ethanol, which became commercially significant in the 1970s after the phase-out of lead in gasoline. Ethanol blending has been supported by various government policies, including tax incentives and the Renewable Fuel Standard. Ethanol production surged, particularly in the Midwest, driven by high corn production. While ethanol offers economic and environmental benefits, it also raises concerns about environmental impacts and the efficacy of subsidies. Changes in ethanol demand significantly affect corn prices and agricultural practices.
Explore the world’s hydropower plants in 2022
Hydropower, a pioneer in grid-scale electricity generation since the late 19th century, now provides 17% of global electricity, surpassing nuclear, wind, solar, bioenergy, and geothermal combined. While the US and Europe have well-established capacity with limited room for expansion, China, India, Africa, and South America are developing new projects to meet rising electricity demand and reduce greenhouse gas emissions.
The history of global oil production
The commercial extraction of oil began in the 19th century in the US and Russia, initially for kerosene production. The introduction of the internal combustion engine increased oil demand. The Spindletop discovery in 1901 accelerated US oil production. OPEC’s formation in 1960 and market conditions led to price volatility, with consumption rising steadily in the 2000s.
Where are the world’s most valuable oil and gas companies?
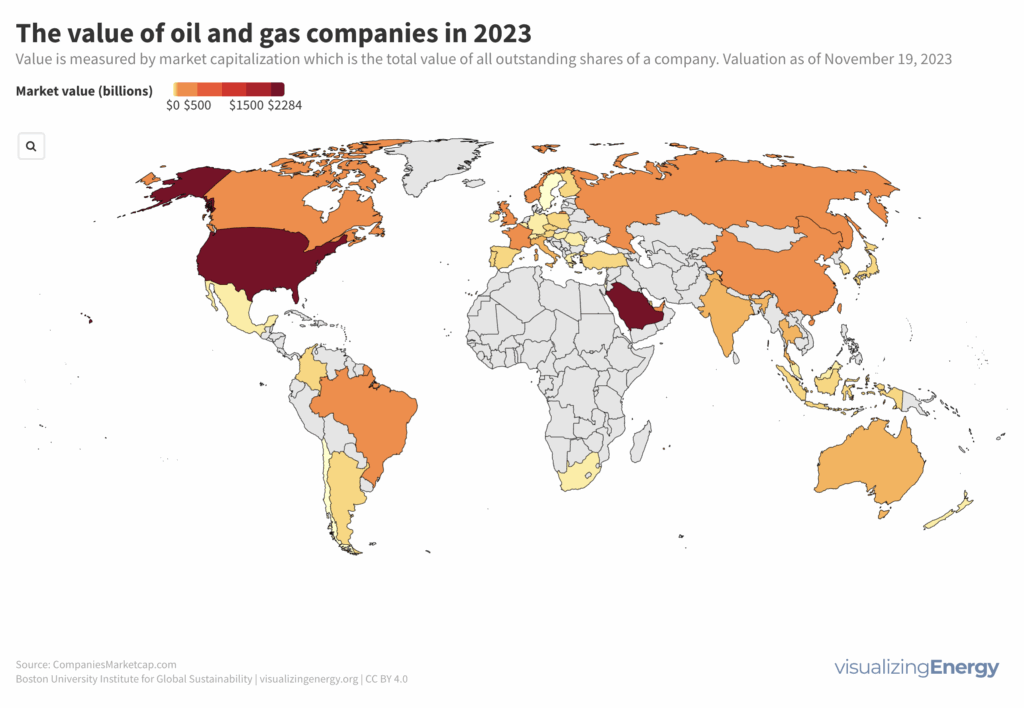
Oil and natural gas make up 55% of global energy use, with the top 350 companies holding a combined market cap of $7.2 trillion, comprising 7% of the world’s largest companies. State-owned enterprises control 90% of the world’s crude oil reserves. Just 8 companies hold 50% of the market cap.
The history of natural gas production in the United States
Approximately 4934 trillion cubic feet of gas have been produced globally since 1900, with the United States contributing around 30%. Texas and Louisiana account for over half of US natural gas production. The introduction of fracking led to a significant increase in production, making the US a major exporter.
How has the technology of hydropower changed since 1898?
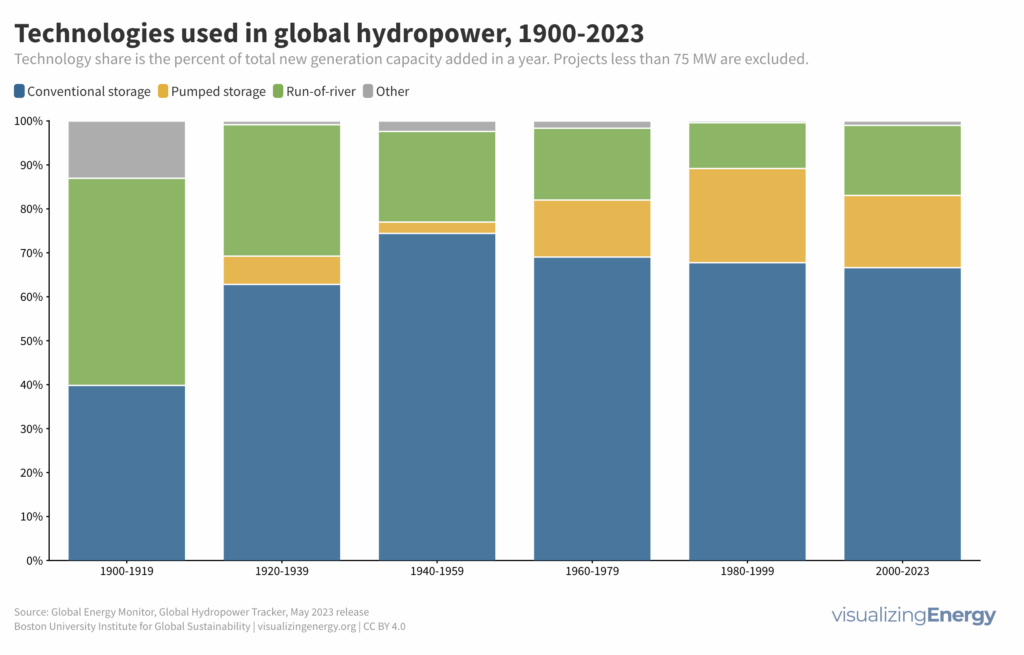
Hydropower plants utilize different technologies to generate electricity. Impoundment facilities use a dam to create a reservoir, releasing water through turbines. Run-of-river plants channel river water to generate power while pumped storage hydropower stores energy by moving water between reservoirs of different elevations. Each technology has its advantages and impacts on the environment and infrastructure.
The history of global natural gas production
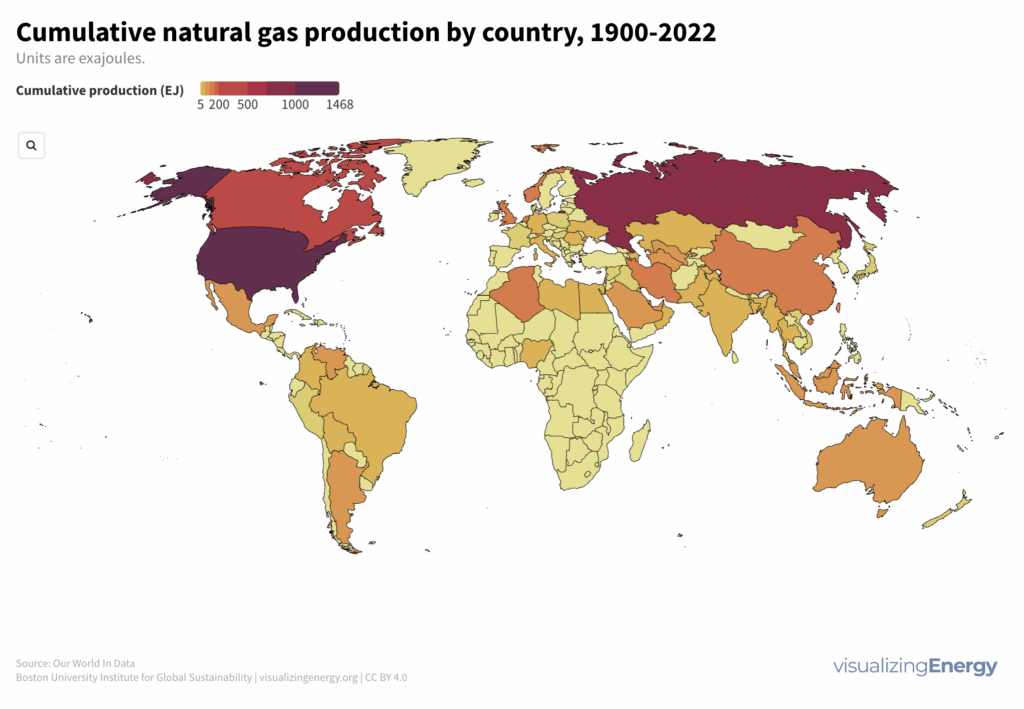
Natural gas, once a byproduct, now comprises a quarter of global energy. Advancements in infrastructure and technology, along with increasing demand, have propelled its rise. However, its contributions to greenhouse gases and geopolitical tensions present challenges for sustainability and climate change goals.
What are capacity factors and why are they important?
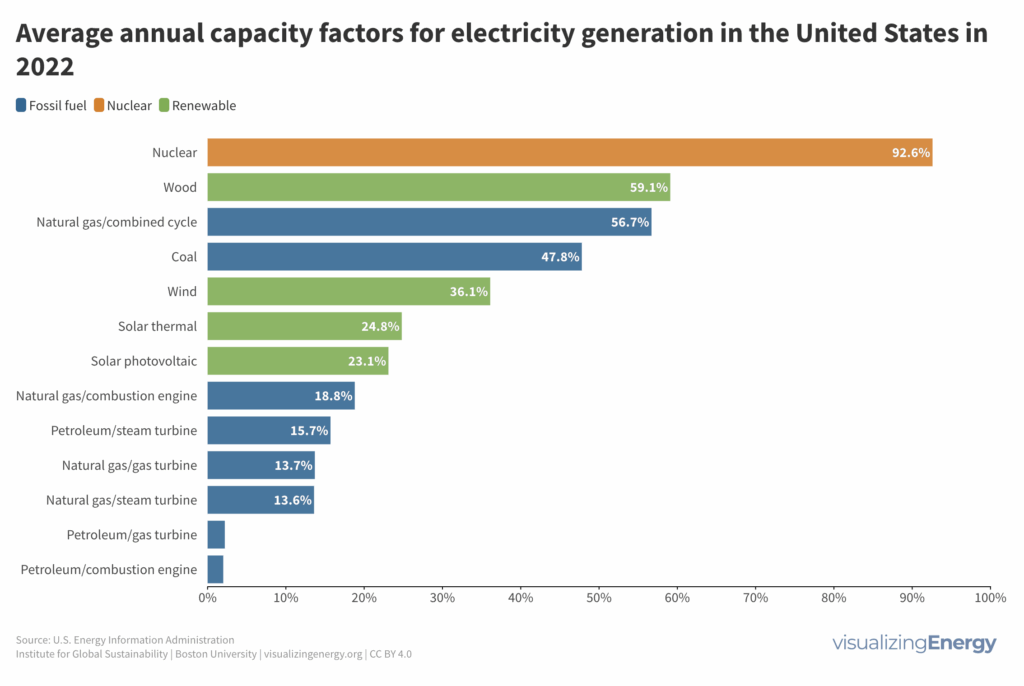
The capacity factor is a crucial measure for electricity generation. It represents the ratio of actual electrical energy production to the maximum possible output over a specific period. Nuclear plants lead with a 90%+ factor, while renewable sources like wind and solar struggle due to intermittency. New challenges arise with climate change impacting demand and production patterns.